Graph
Graph
Access the Graph module via the left-hand menu of your project. Graph provides real-time, interactive plotting without a single line of code. You can create common scientific figures and finetune every detail through an extensive set of options. All changes are rendered instantly, and the final image can be downloaded in PNG, JPEG, SVG, or as a ZIP bundle containing all three formats. The list of chart types will keep growing to meet diverse online-plotting needs.
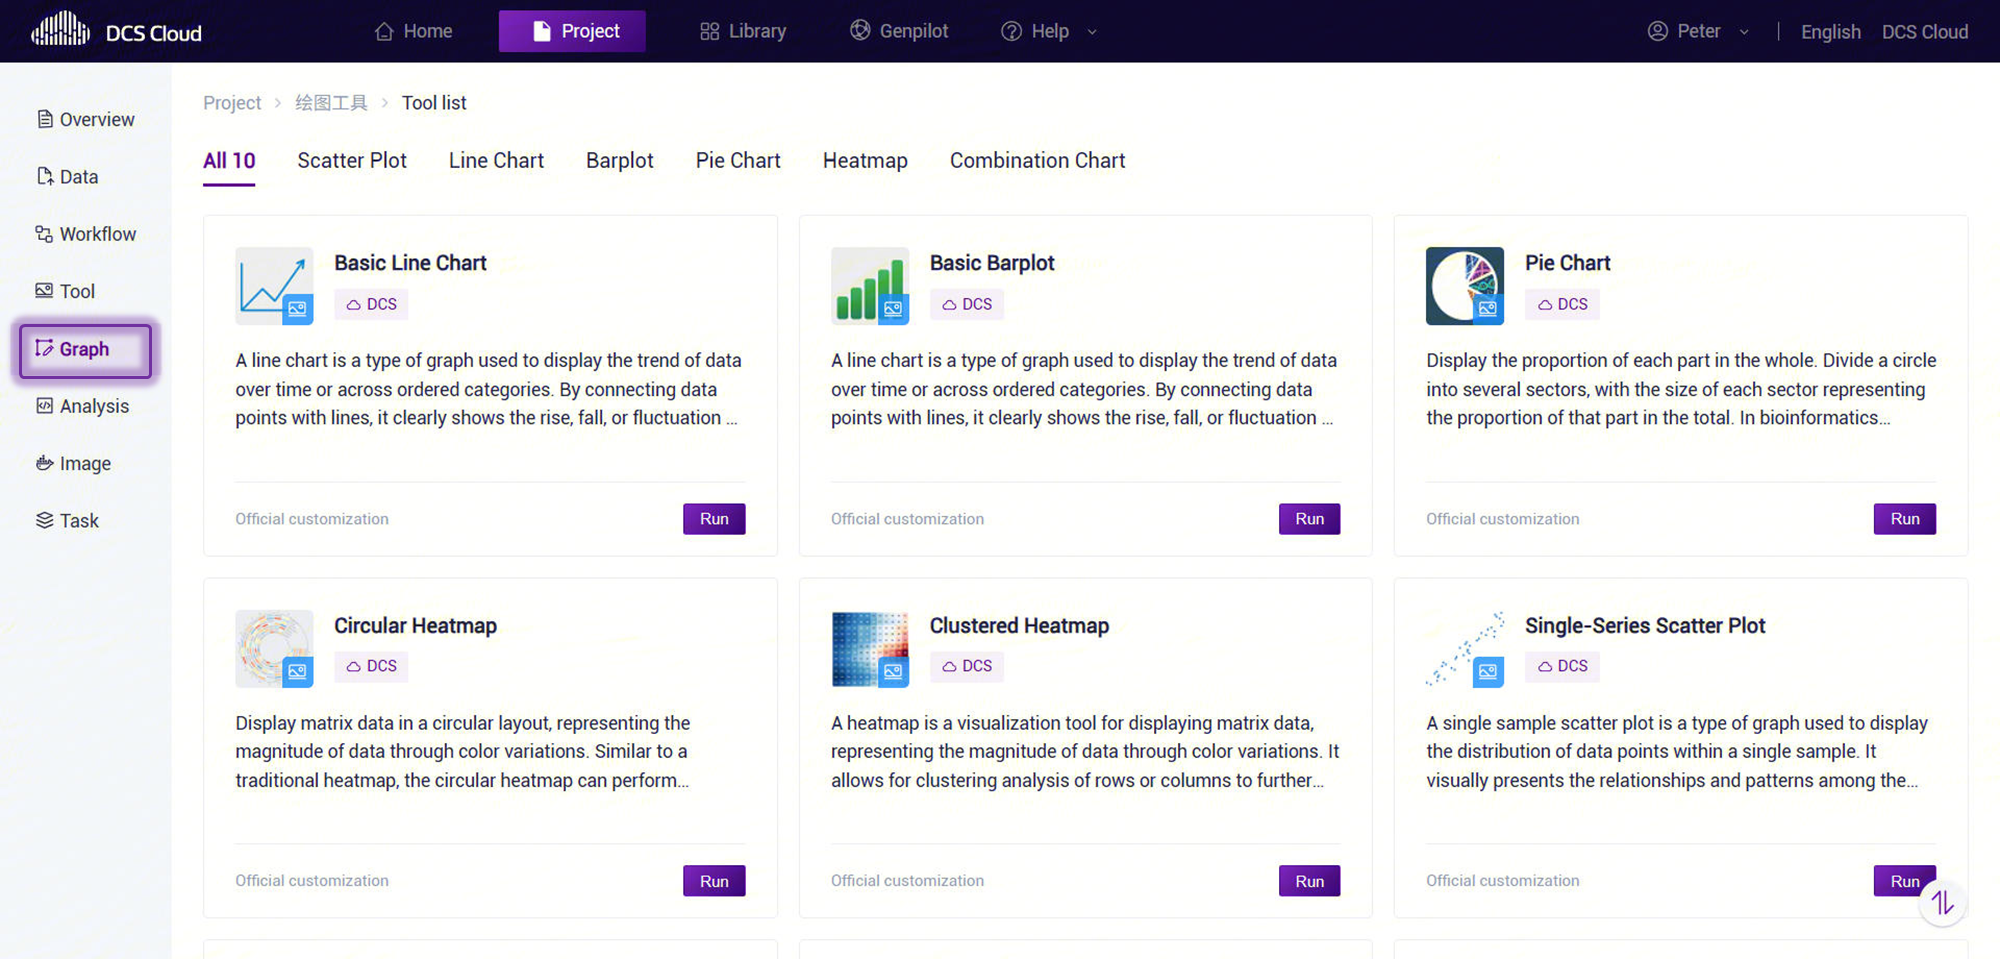
After selecting the chart type, you will enter the tool-specific workspace. Each workspace is divided into three panels: Data Preview, Plot Area, and Parameter Panel.
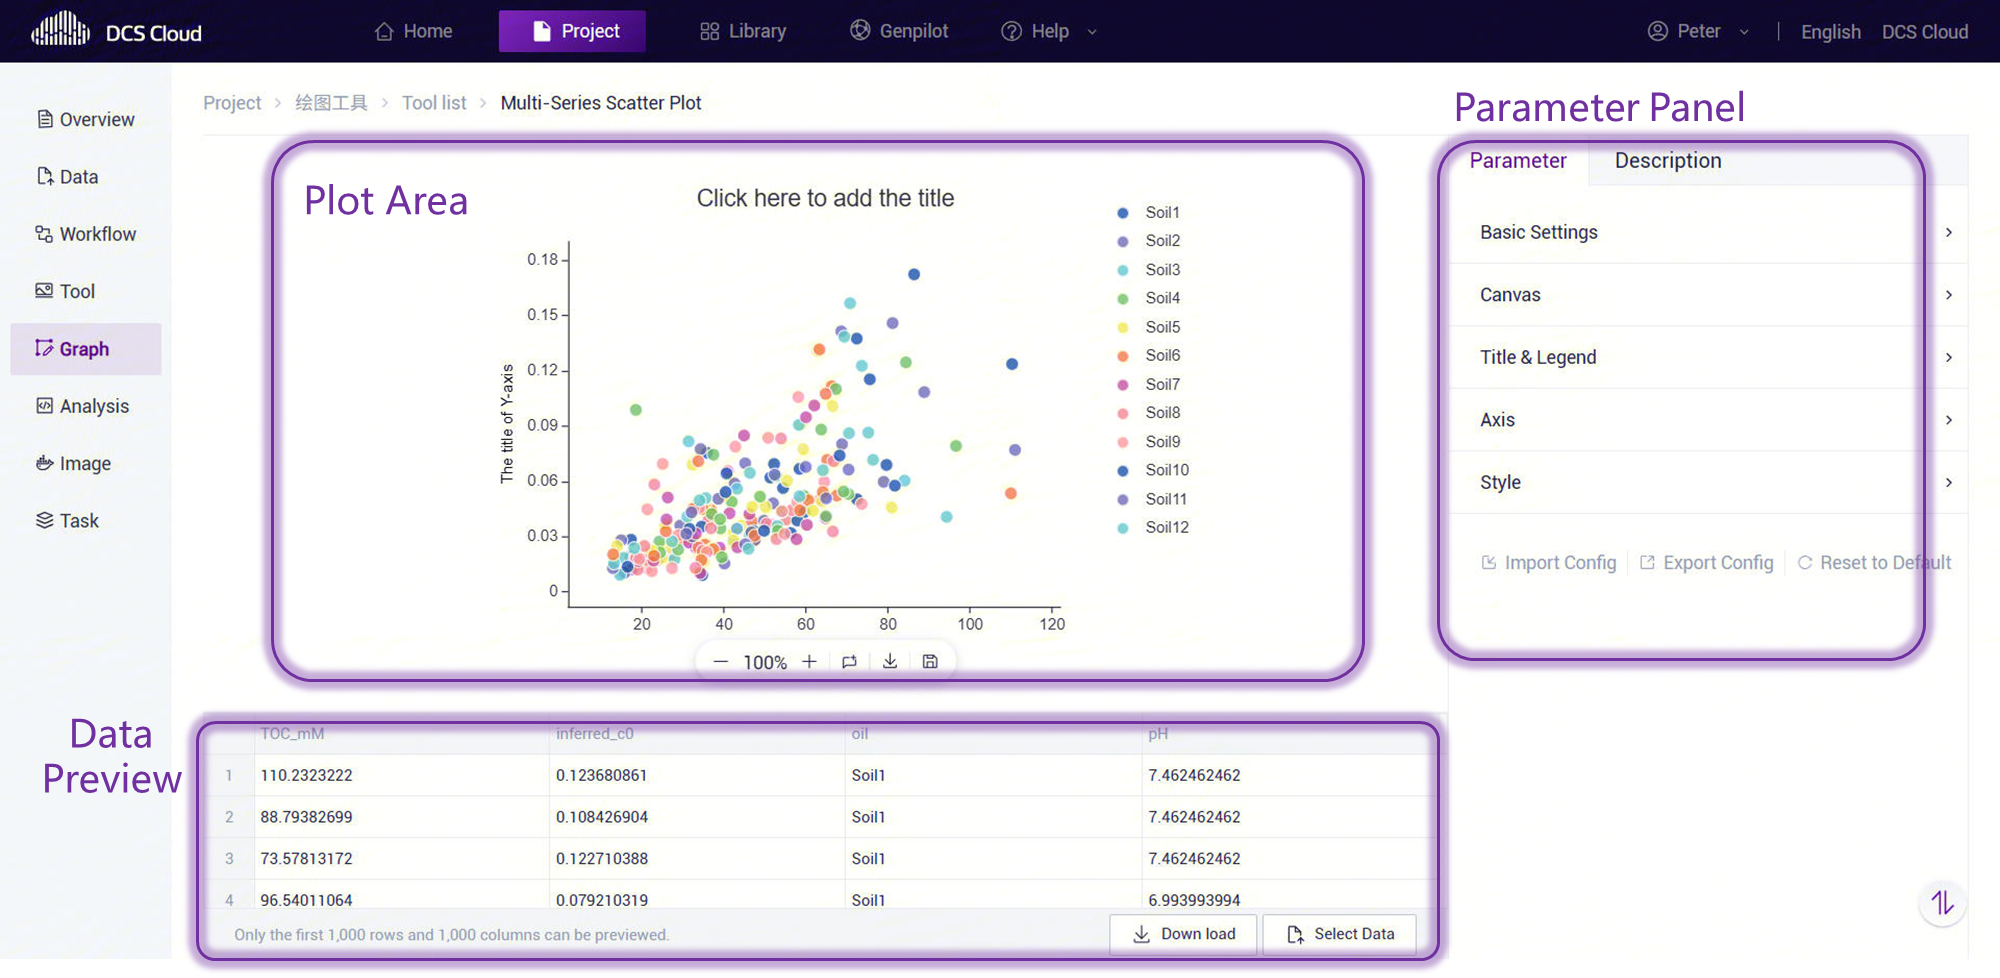
Plot Area
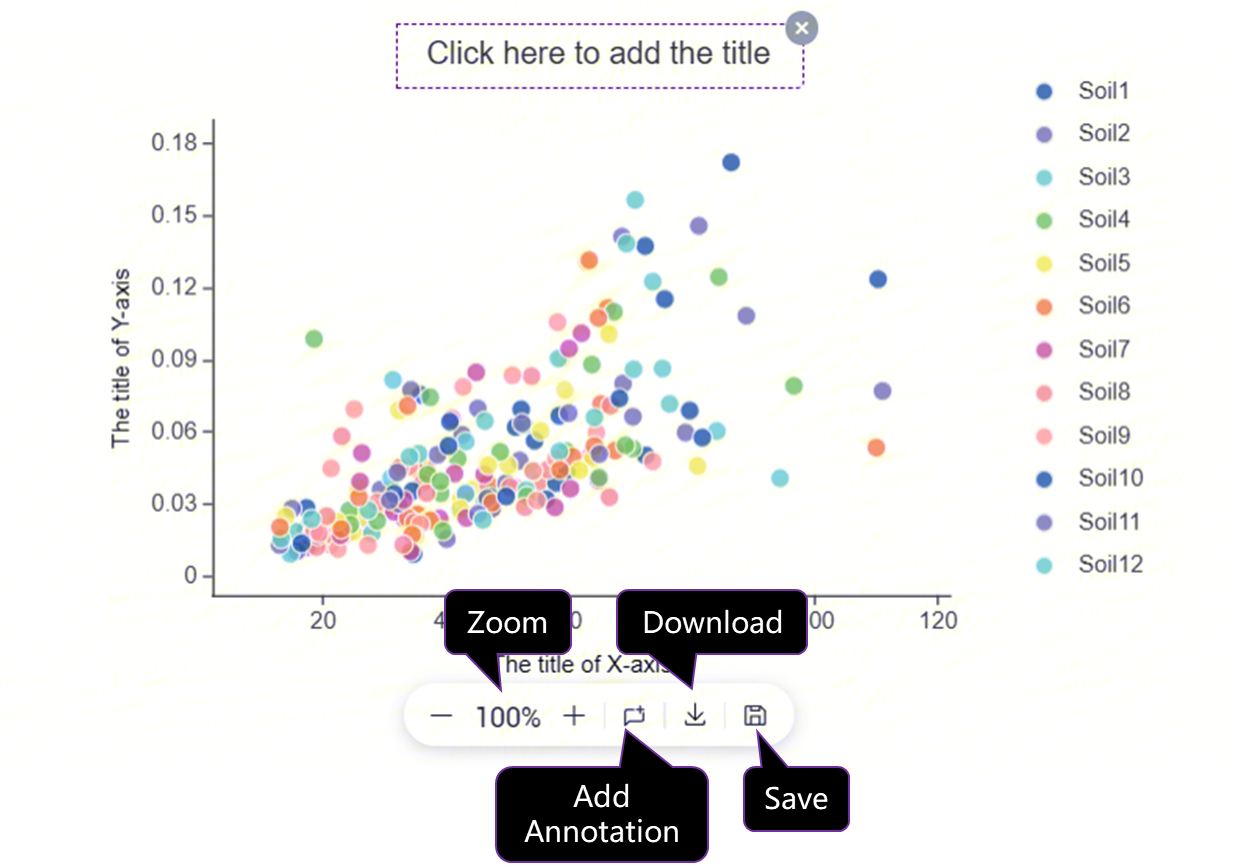
This is where the figure is rendered. Below the canvas, a toolbar offers:
Zoom: Adjust the overall scale of the plot. Note that existing annotations do not move with zooming.
Add Annotation: Opens an annotation editor. Click the left edge of the editor to toggle between TEXT and LaTeX modes. LaTeX syntax rules can be found at https://en.wikibooks.org/wiki/LaTeX/Mathematics.
Download: Save the figure to your local computer in PNG, JPEG, SVG, or as a ZIP bundle.
Save: Store the figure in the project’s Data in PNG, JPEG, SVG, or as a ZIP bundle.
When an annotation or chart title is selected, you can rotate the text box with the mouse wheel. In edit mode, you can change font family, size, and color.
Data Preview

Preview your data here. By default, sample data for the current tool are loaded. You can:
Download the sample data with the Download button (bottom-right).
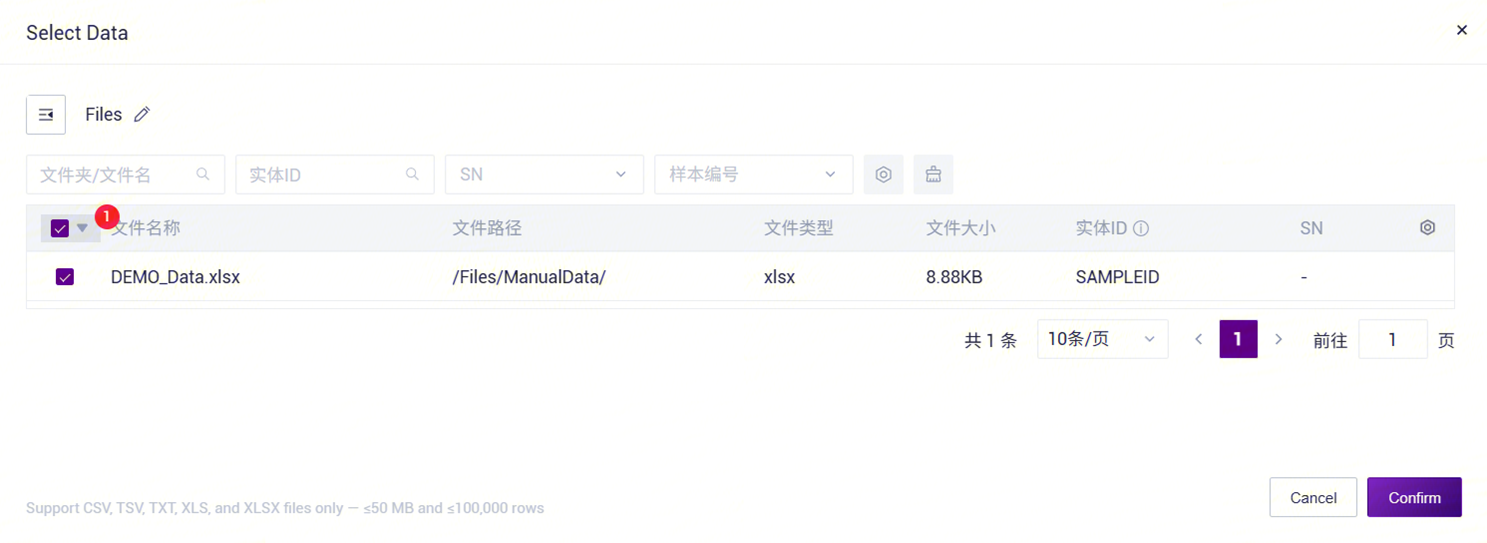
Import your own data with the Select Data button, which opens files stored in Data.
– Only the first 1 000 rows and 1 000 columns are previewed.
– Supported formats: TSV, CSV, XLS, XLSX, TXT.
– File size must not exceed 50 MB.
Parameter Panel
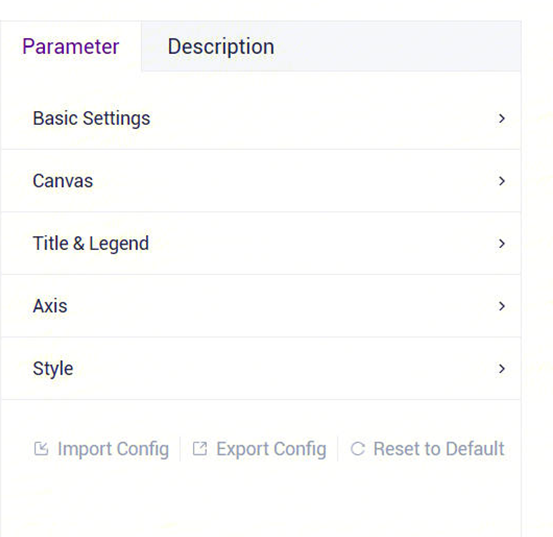
Graph offers rich, flexible customization. Parameters are grouped into:
Basic Settings: Title, axis labels, color schemes, legend position.
Canvas: Dimensions of the plot area and margins (top, bottom, left, right).
Title & Legend: Show/hide, font, font size, and other detailed settings.
Axis: Range, font, line style, and ticks for both X and Y axes.
Style: Chart-specific options (e.g., point size and shape for scatter plots).
You can export your current configuration as a JSON file via Export Settings and save it to Data. Later, use Import Settings to apply the same style to new or updated datasets.
