MSAP User Manual
MSAP User Manual
Version Information
| Manual Version | Process Version | Revision Date | Summary of Revision Content |
|---|---|---|---|
| A1 | V1.0.1 | July 2025 | * First release |
Note: Please download the latest version of the manual and use it in accordance with the orresponding version of the process.
Product Information
Product Description
Metagenomics refers to the collection of genomes of all microbial populations in a specific environment, including various microorganisms such as bacteria, fungi, and viruses. Metagenomic sequencing can directly perform high - throughput sequencing and analysis on all microbial DNA in environmental samples without the need for isolation and culture. It is an important means to study microbial diversity, community structure, functional genes, and their interaction relationships with the environment. With the continuous advancement of sequencing technology and the reduction of costs, metagenomic sequencing has become an important research tool in fields such as microbial ecology, environmental science, and medicine due to its advantages of high throughput, comprehensiveness, and high sensitivity.
The Metagenomic Analysis Process (hereinafter referred to as MSAP) sequences all microbial genomes in environmental samples. Through steps such as pre - processing of high - quality data, removal of host contamination, assembly, species annotation, and functional annotation, it comprehensively analyzes the composition, structure, and functional potential of microbial communities. Metagenomic research provides strong technical support for revealing the role of microorganisms in ecosystems, the impact of environmental changes on microbial communities, and the interaction mechanism between microorganisms and hosts. It has been widely used in basic research, disease diagnosis, agricultural improvement, and environmental governance in various environments such as soil, oceans, and intestines.
The core of MSAP lies in the comprehensive analysis of the structure and function of microbial communities. It uses bioinformatics and statistical methods to compare the diversity and functional differences of microbial communities under different environmental or treatment conditions, screen out key microorganisms and functional genes related to specific environments or phenotypes, and further explore their ecological significance. The analysis process includes data quality control, removal of host sequences, assembly, species and functional annotation, community diversity analysis, and generation of visual reports. It realizes sample management and result display through a user - friendly graphical interface, supports parallel task processing, greatly improves analysis efficiency, and achieves efficient and rapid interpretation and delivery of metagenomic data.
Precautions
This product is only for scientific research purposes and not for clinical diagnosis. Please read this manual carefully before use.
This manual and the information it contains are the proprietary and confidential information of BGI - Shenzhen (hereinafter referred to as Shenzhen BGI Research Institute). Without the written permission of Shenzhen BGI Research Institute, no individual or organization shall reproduce, copy, modify, disseminate, or disclose all or part of this manual to others. The readers of this manual are end - users, and Shenzhen BGI Research Institute authorizes end - users to use it. Unauthorized individuals are strictly prohibited from using this manual.
Shenzhen BGI Research Institute makes no warranties of any kind for this manual, including (but not limited to) the implied warranties of merchantability and fitness for a particular purpose. Shenzhen BGI Research Institute has taken measures to ensure the accuracy of this manual. However, Shenzhen BGI Research Institute is not responsible for errors or omissions and reserves the right to improve this manual and the process to enhance its reliability, functionality, or design.
All pictures in this manual are schematic diagrams, and the content of the pictures may have slight differences from the actual user interface. Please refer to the actual user interface.
Product Introduction
Analysis Workflow
The MSAP analysis process is an automatic analysis process developed based on the DCS cloud platform system. It includes data filtering, removal of host sequences, species identification, differential species analysis, Alpha diversity analysis, genome assembly, gene structure prediction, construction of a non - redundant gene set, gene abundance calculation, gene functional annotation, and report generation.
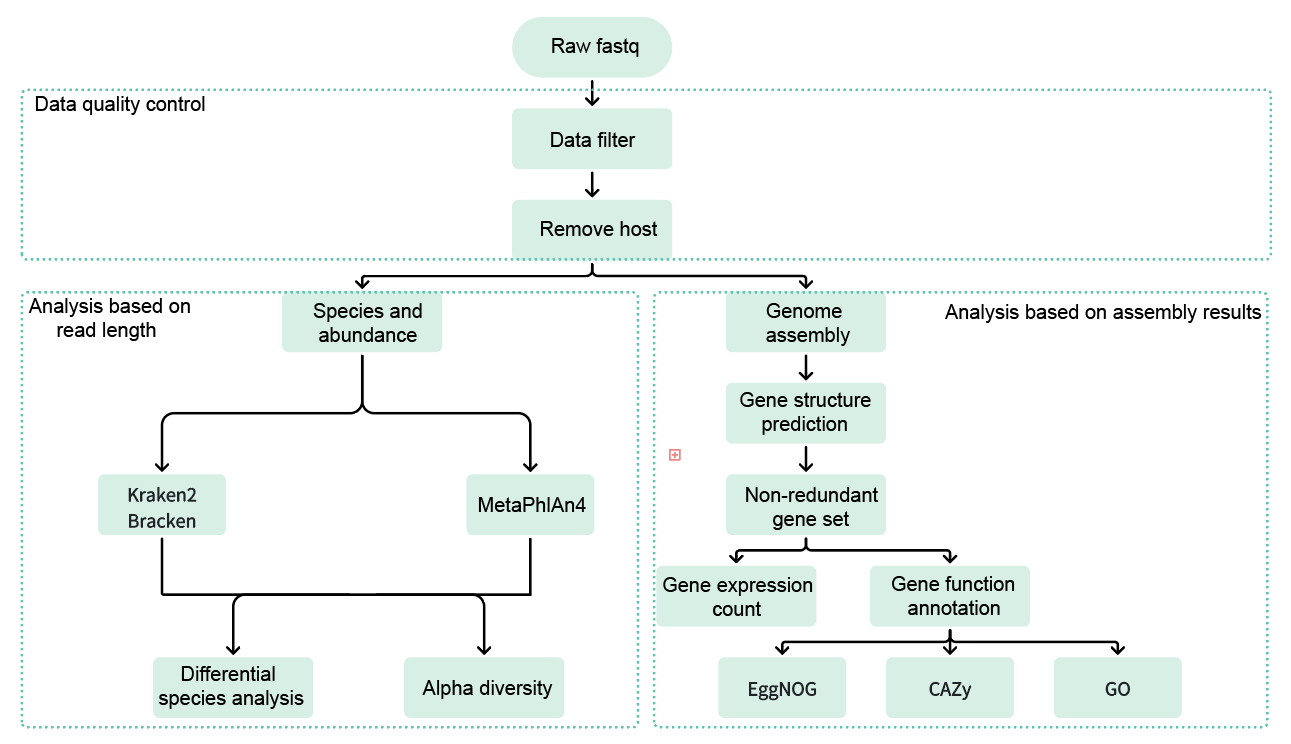
Figure 2.1 Analysis system flowchart
Data Filtering
Use fastp to perform quality control and filtering on the original sequencing data, including filtering of low - quality sequences, removal of adapter sequences, and length screening. After processing with fastp, output the sequencing quality statistical information before and after quality control, including base quality distribution, sequence length distribution, and GC content distribution. The clean data (high - quality data) obtained after filtering will be used for subsequent alignment and analysis to ensure the accuracy and reliability of the analysis results.
Removal of Host Sequences
Use the Minimap2 software to align the filtered clean reads with the host genome sequence. By identifying and removing the sequences that match the host genome, obtain the microbial genome data without host contamination. After the alignment is completed, output the alignment result file and count the data volume before and after removing the host sequences to provide high - quality non - host clean data for subsequent metagenomic analysis.
Species Identification
Use Kraken2 and Bracken (or MetaPhlAn4) to perform metagenomic species identification on the clean data after removing the host sequences. Kraken2 is an efficient metagenomic classification tool based on k - mer, which can quickly and accurately classify and annotate microbial sequences. Bracken can further optimize the quantitative analysis of species abundance based on the Kraken2 classification results. MetaPhlAn4 performs species annotation and abundance estimation based on specific marker genes and is suitable for high - resolution analysis of microbial community structure.
After performing species identification on the samples using the above tools, obtain the species abundance matrix of each sample to comprehensively reflect the composition and structure of the microbial community. The analysis process also includes the visual display of species abundance data to intuitively show the microbial diversity and abundance distribution among different samples. At the same time, generate rarefaction curves based on the species abundance matrix to evaluate the impact of sequencing depth on the capture of species diversity and determine whether the sequencing data meets the requirements for subsequent analysis.
Differential Species Analysis
Use the microeco software based on the LEfSe algorithm (Linear discriminant analysis Effect Size) to perform inter - group differential species analysis on multiple groups of samples. The LEfSe algorithm can combine statistical tests and LDA (Linear Discriminant Analysis) to screen out the species with significant differences between different groups and evaluate their contribution to group discrimination. Perform LEfSe analysis on the species abundance data using microeco to identify the differential species with statistical significance between groups and calculate the LDA score of each species. The analysis results are presented in a bar chart showing the top 30 species ranked by LDA score to intuitively reflect the dominant species and their discrimination ability between different groups.
Alpha Diversity Analysis
Use the vegan software package to perform Alpha diversity analysis on the samples, calculating the Chao1 index (reflecting species richness), Simpson index, and Shannon index (reflecting species diversity and evenness) of each sample. The analysis results can comprehensively show the species diversity level of each sample and provide basic data for subsequent community structure comparison and ecological analysis.
Genome Assembly
Use the MEGAHIT software package to assemble the clean data after removing the host sequences by sample. After the assembly is completed, perform length screening on the results, filtering out fragments with a length of less than 300bp, and only retaining contigs with a length of greater than or equal to 300bp for subsequent statistical analysis and gene prediction.
Gene Structure Prediction
Use the Prodigal software package to predict the gene structure of the assembled genome sequences, identifying the start and end positions of genes and predicting the coding regions (CDS) and their corresponding protein sequences. By predicting the gene structure of the assembled contigs, obtain the gene annotation information and protein sequences of each sample, providing basic data for subsequent functional annotation and diversity analysis.
Construction of Non - Redundant Gene Set
Use the MMseqs2 software package to perform redundancy removal on the predicted gene structures and generate a non - redundant gene set. By clustering the gene prediction results of all samples and merging homologous or highly similar genes, obtain a representative non - redundant gene set (Unigene set), providing high - quality gene resources for subsequent functional annotation, abundance analysis, and diversity research.
Gene Abundance Calculation
Use the Salmon software package to perform abundance quantification analysis on the non - redundant gene set and obtain the expression abundance of non - redundant genes in each sample. By aligning the clean data with the non - redundant gene set using Salmon, generate the gene abundance matrix of each sample to comprehensively reflect the functional composition and abundance distribution of the microbial community. The results include the visual display of abundance data to intuitively show the gene abundance differences between different samples.
Gene Functional Annotation
Perform gene functional annotation on the non - redundant protein sequences using multiple authoritative databases and analysis tools. Use the Diamond software to perform rapid alignment and functional annotation on the protein sequences based on the CAZy and GO databases, identifying functional information related to carbohydrate - active enzymes and Gene Ontology. Use the emapper.py tool to perform annotation based on the EggNOG database to comprehensively analyze the evolutionary relationships and functional categories of proteins.
Report Generation
Comprehensively analyze the results and compile them into an HTML report.
User Manual
The MSAP analysis process manages the entire process of sample input and report output through the DCS cloud platform system. The following specifically introduces the operation guide for using the MSAP analysis process based on the DCS cloud platform system.
Guide Overview
Overview
This chapter introduces how to use the MSAP analysis process for analysis. Before use, please carefully read and understand the content to ensure the correct use of the MSAP analysis process.
Usage Scenario 1: Manual Submission
The operation includes four steps: uploading data, constructing a host reference genome (optional), entering sample information, and starting the analysis. After completing the sample information entry, run the task. When the customer sees the task status as completed, it means the task is completed, and the report section can be viewed (see section 3.4 for details).
Step 1: Upload Data
- Click 【Data】 on the navigation bar to enter the data management page. Enter the target folder and click 【+Add files】-【Tool upload】 to upload data (Figure 3.1).
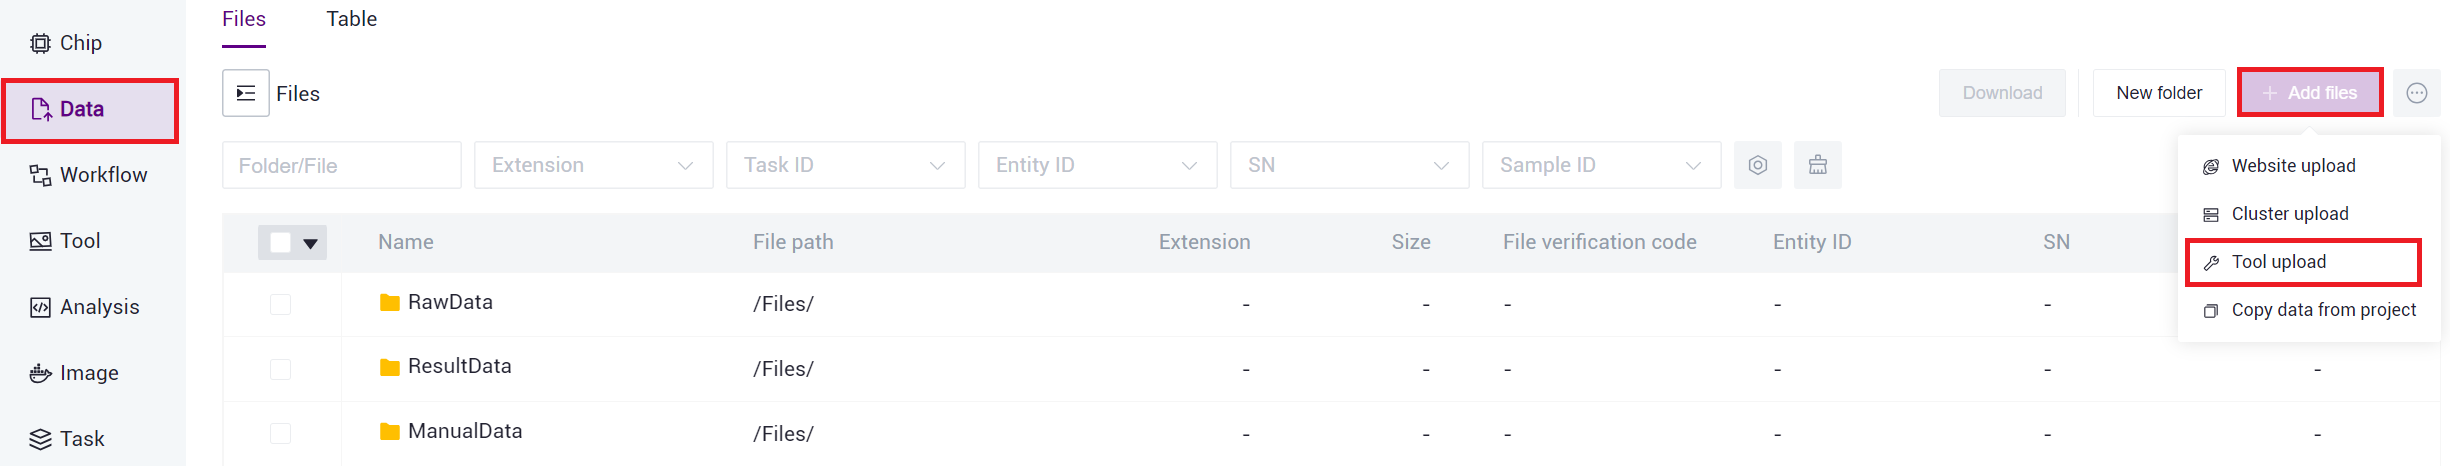
Figure 3.1 File upload step one
- Click 【Upload】 to browse and select the required files (Figure 3.2). After the upload is completed, the files will be displayed in the target folder (if uploading for the first time, click 【Install and start transport client】 to install the required tools).
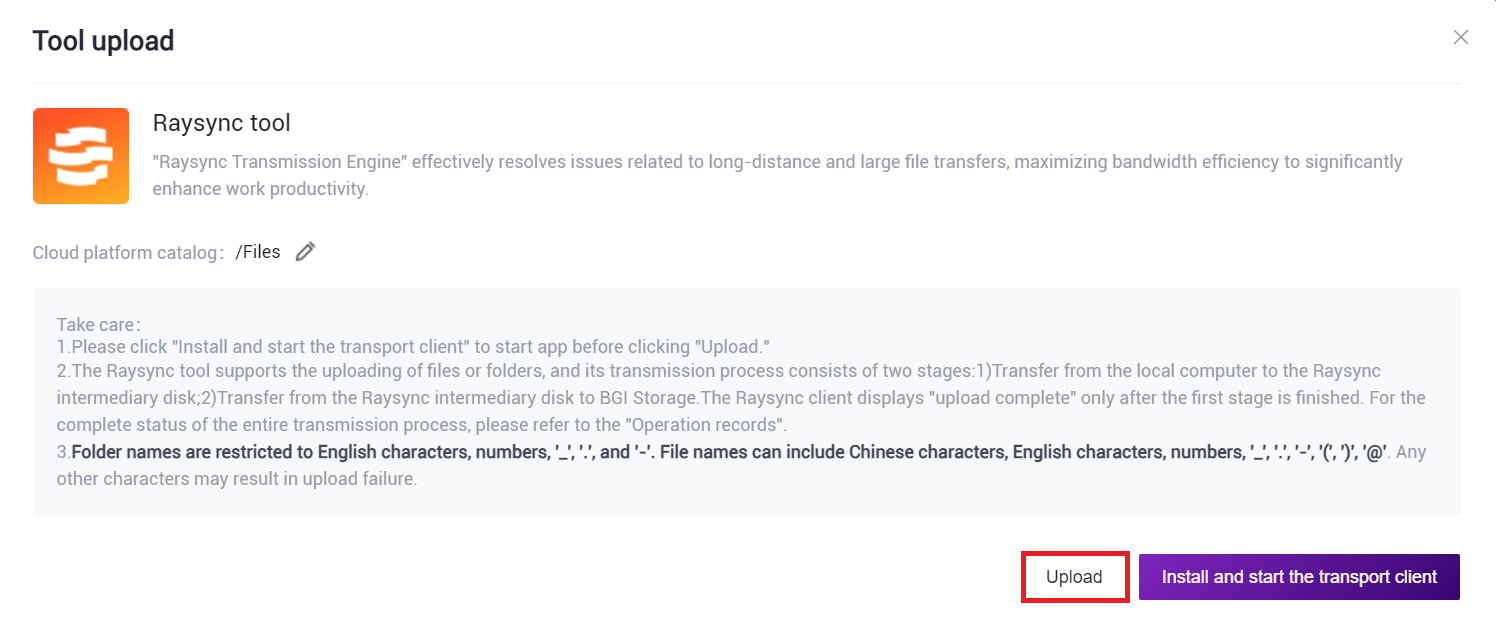
Figure 3.2 File upload step two
Step 2: Construct Host Reference Genome (Optional)
- Click 【Workflow】 on the navigation bar to enter the process analysis page. Enter minimap2-build-host-reference in the search box and click 【Run】 (Figure 3.3).
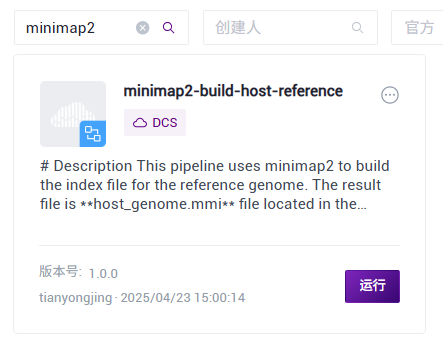
Figure 3.3 Construct reference genome step one
- Select Run workflow, enter the Entity ID, and click 【Next】 (Figure 3.4).
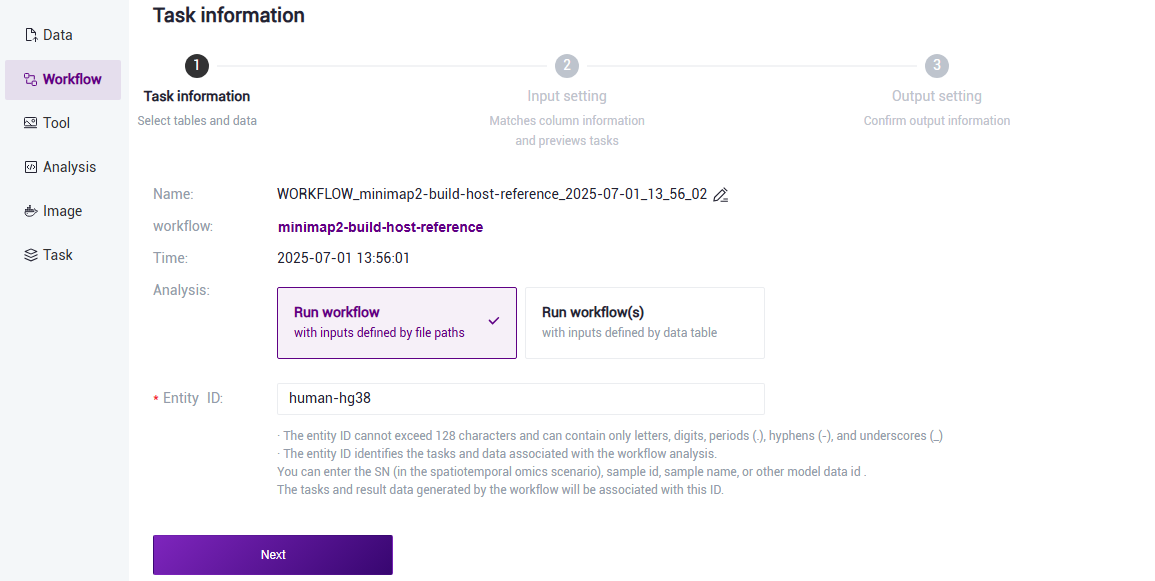
Figure 3.4 Construct reference genome step two
- Enter the reference genome information and click 【Next】 after completion (Figure 3.5).
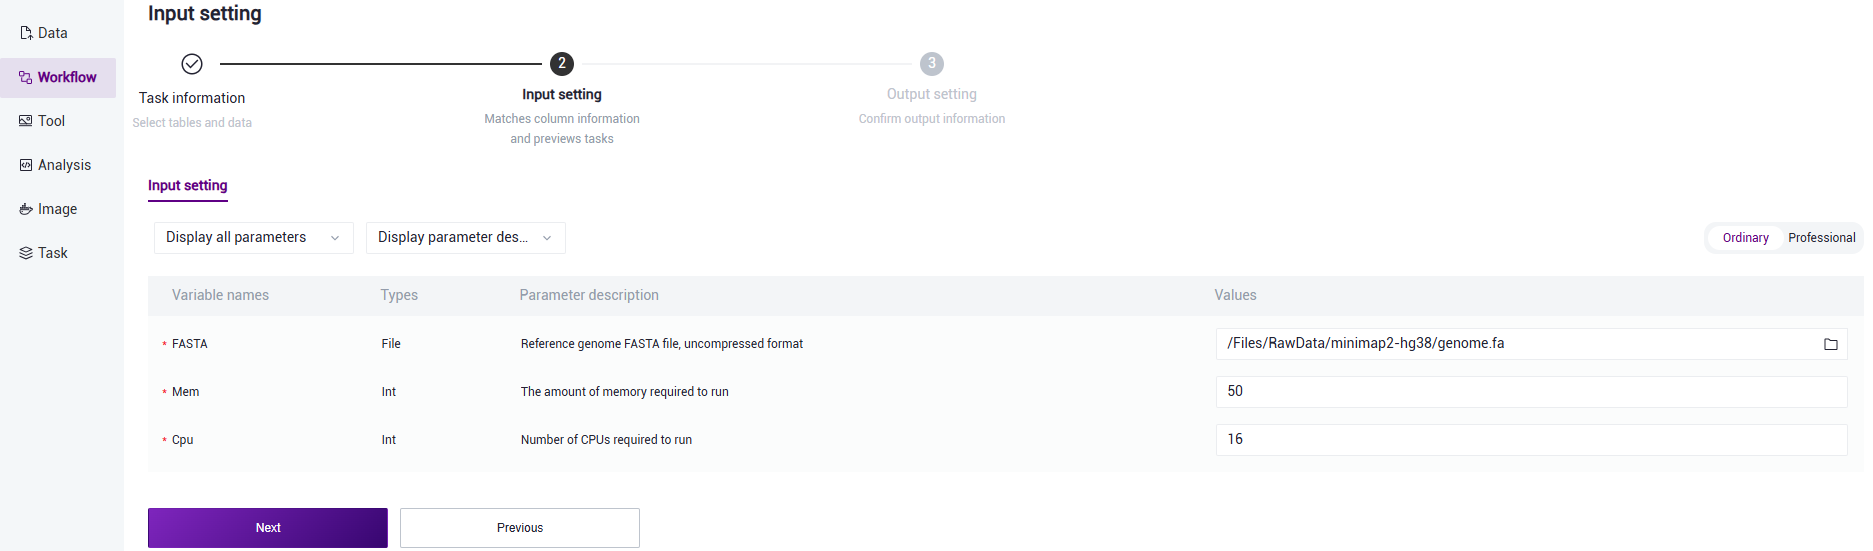
Figure 3.5 Construct reference genome step three
Parameter description for reference genome information entry: FASTA: Genome FASTA file, compressed format is not supported; Mem: Memory required for task operation; Cpu: Number of threads required for task operation.
- Click 【Run】 to start the analysis (Figure 3.6).
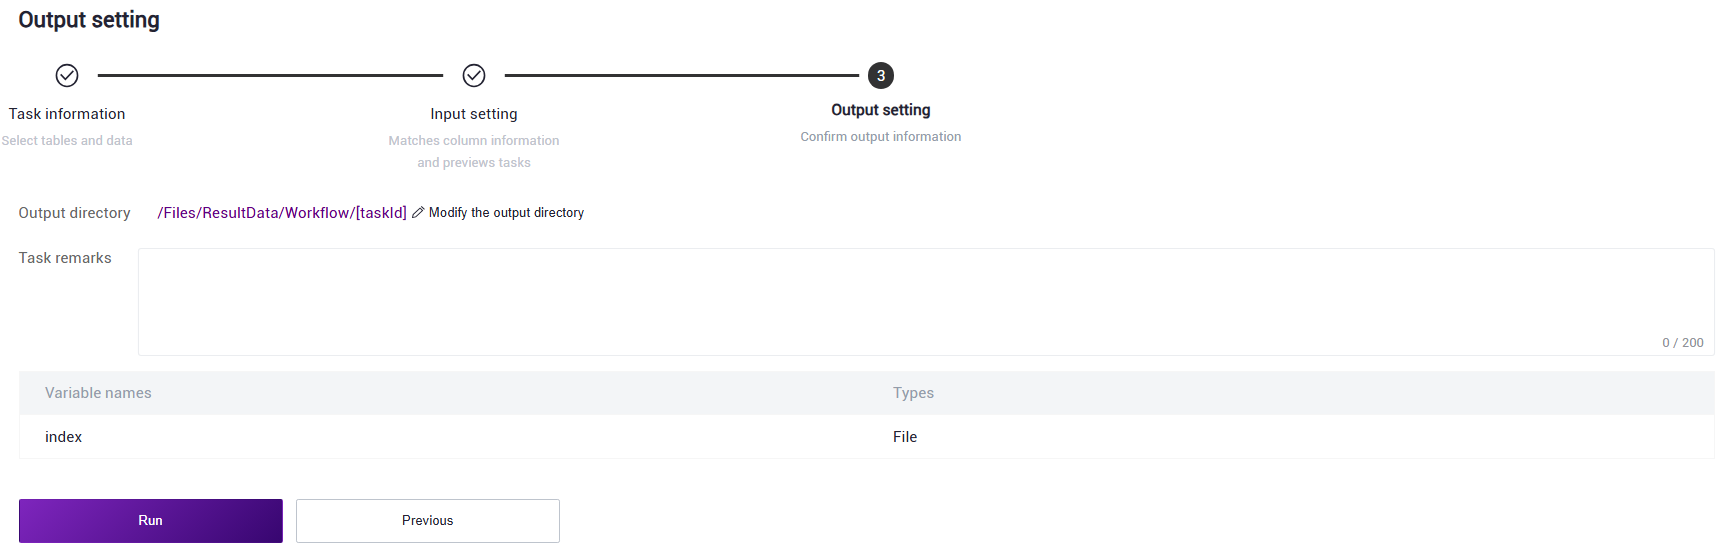
Figure 3.6 Construct reference genome step four
- After the task is completed, the Status shows completed. Copy the Task ID (Figure 3.7), click 【Data】 on the navigation bar, and search for the Task ID. The star_index file serves as the reference genome folder (Figure 3.8).
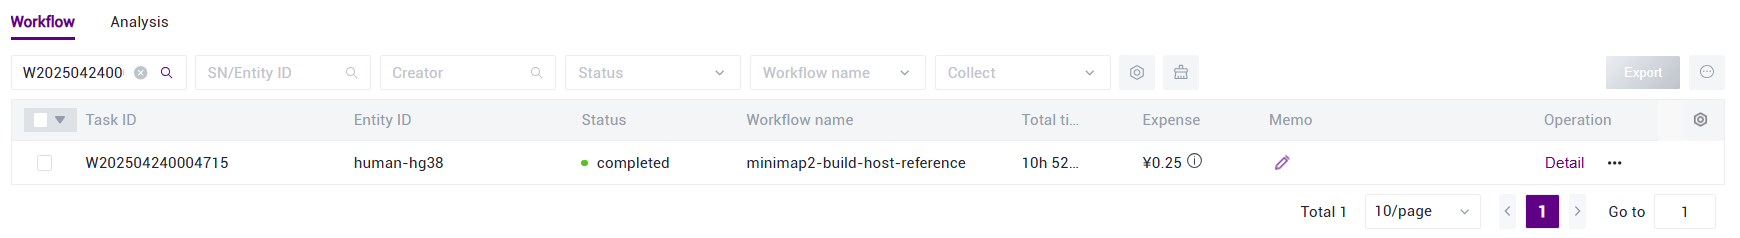
Figure 3.7 Construct reference genome step five
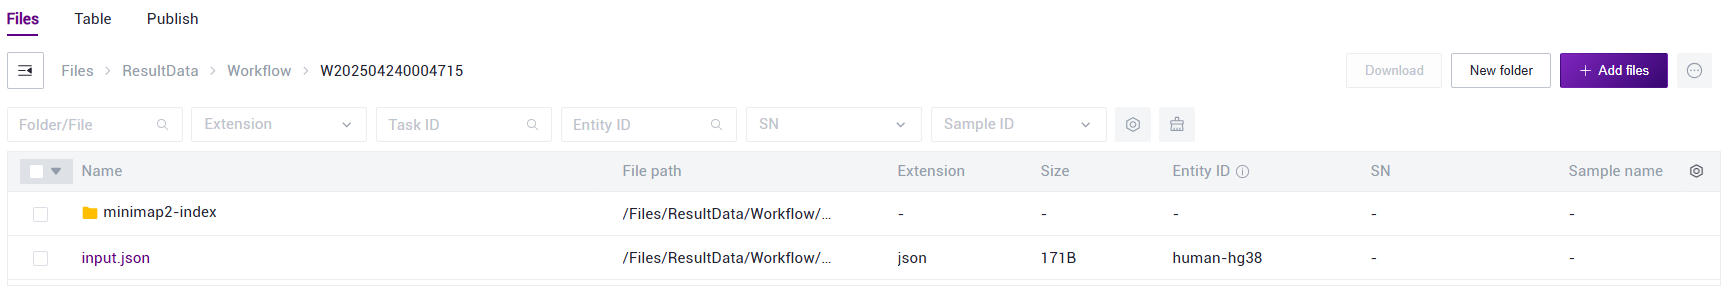
Figure 3.8 Construct reference genome step six
Step 3: Sample Information Entry
- Click 【Workflow】 on the navigation bar to enter the process analysis page. Enter MSAP in the search box and click 【Run】 (Figure 3.10).
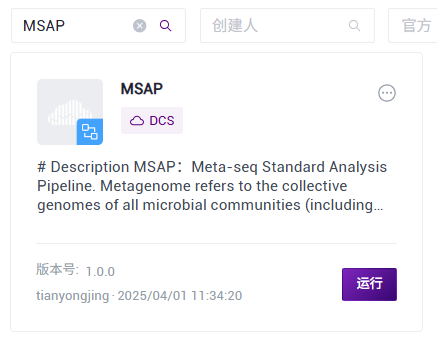
Figure 3.10 Sample information entry step one
- Select Run workflow, enter the Entity ID, and click 【Next】 (Figure 3.11).
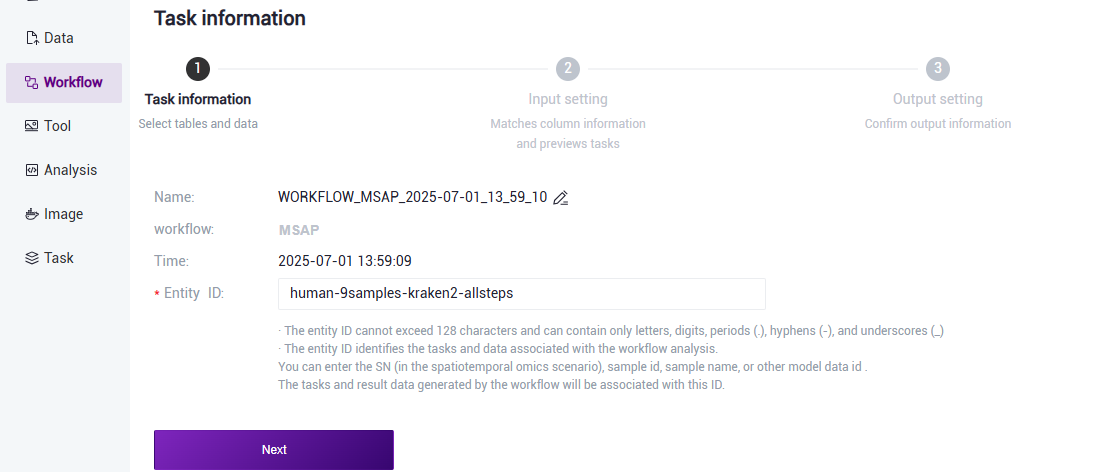
Figure 3.11 Sample information entry step two
- Enter the sample information and click 【Next】 after completion (Figure 3.12).
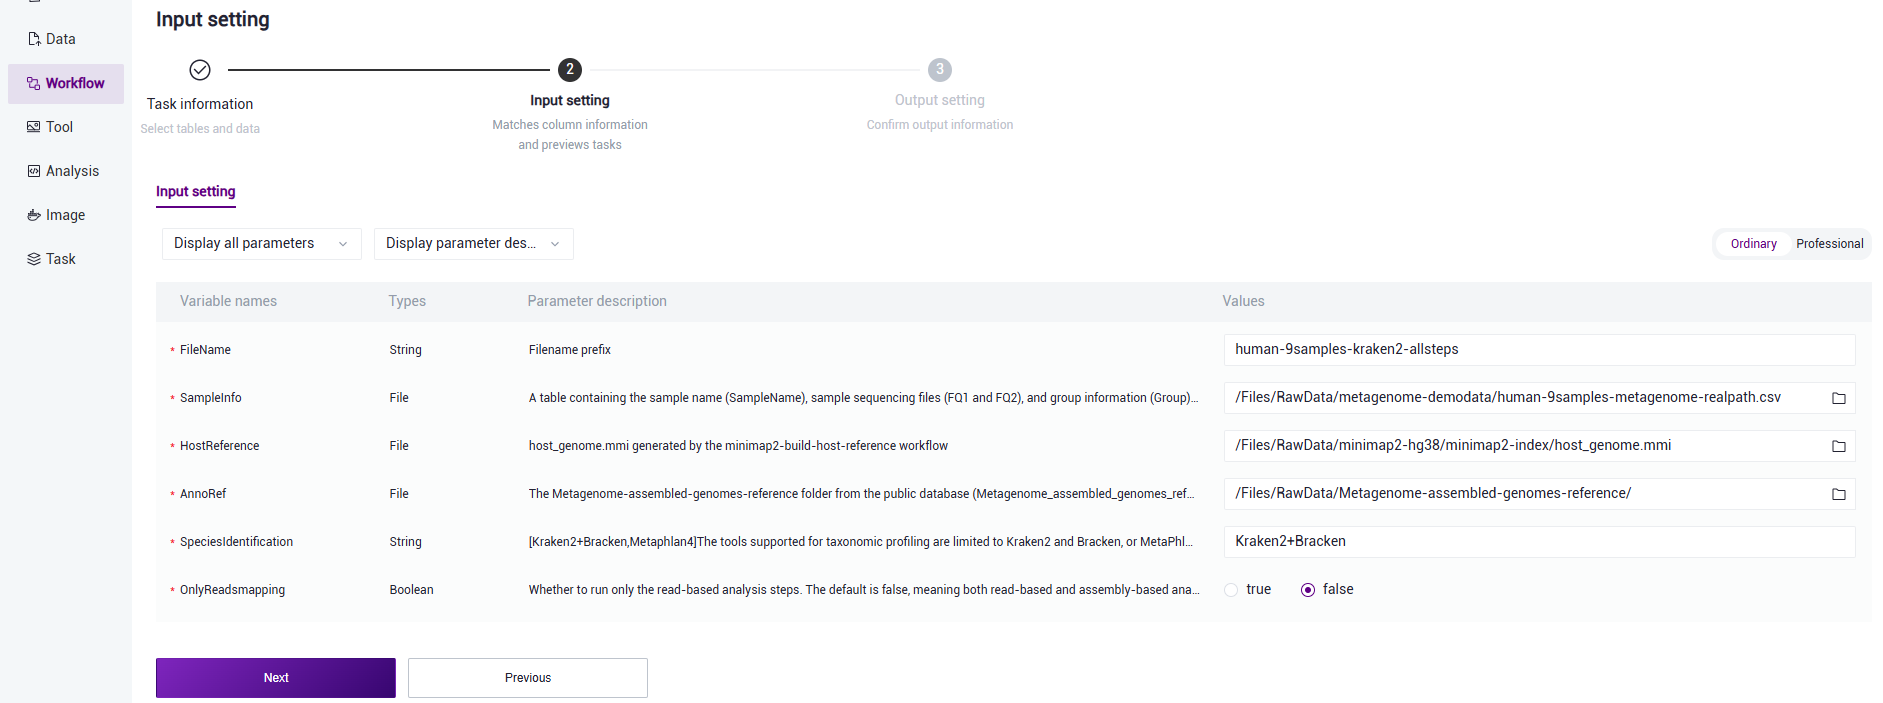
Figure 3.12 Sample information entry step three
Parameter description for sample information entry
FileName: Prefix for the output file name;
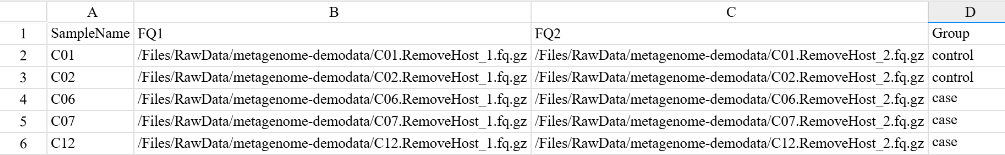
SampleInfo: A table containing the sample name (SampleName), sample sequencing files (FQ1 and FQ2), and grouping information (Group). It should be filled in by the user in Excel, saved as a CSV format, and uploaded to the data management. The sample name should consist of English letters, numbers, and underscores. Samples with the same name are considered the same sample, and all FQ files will be analyzed together. The path of the sample sequencing files should be an absolute path rather than a relative path. For paired - end sequencing data, fill in FQ1 and FQ2 respectively. Single - end sequencing data is not supported. The absolute path on the DCS cloud platform is shown in the following figure:
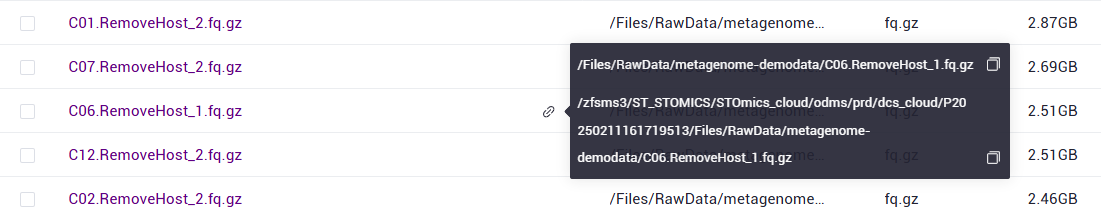
Hover the mouse over the 🔗 symbol next to the file, copy the file path in the red box, and enter it into FQ1 or FQ2 in the table. Grouping is recommended to have biological replicates and should consist of English letters, numbers, and underscores.

HostReference: The reference genome file of the host. If it is independently constructed in step 2 (3.2.2 Construct Host Reference Genome), select the minimap2-index/host_genome.mmi file in the Task ID folder.
AnnoRef: The Metagenome-assembled-genomes-reference folder in the public database (it needs to be copied from the public library Metagenome-assembled-genomes-reference to the data management of the project) for species and functional annotation.
SpeciesIdentification: The tool for species identification, only supporting MetaPhlan4 or Kraken2. Only Kraken2+Bracken or MetaPhlan4 can be filled in. The default is Kraken2+Bracken.
OnlyReadsmapping: Whether to only run the read - based analysis step. The default is false, which means running both the read - based analysis and the assembly - based analysis.
Step 4: Start Analysis
Click 【Run】 to start the analysis (Figure 3.13).
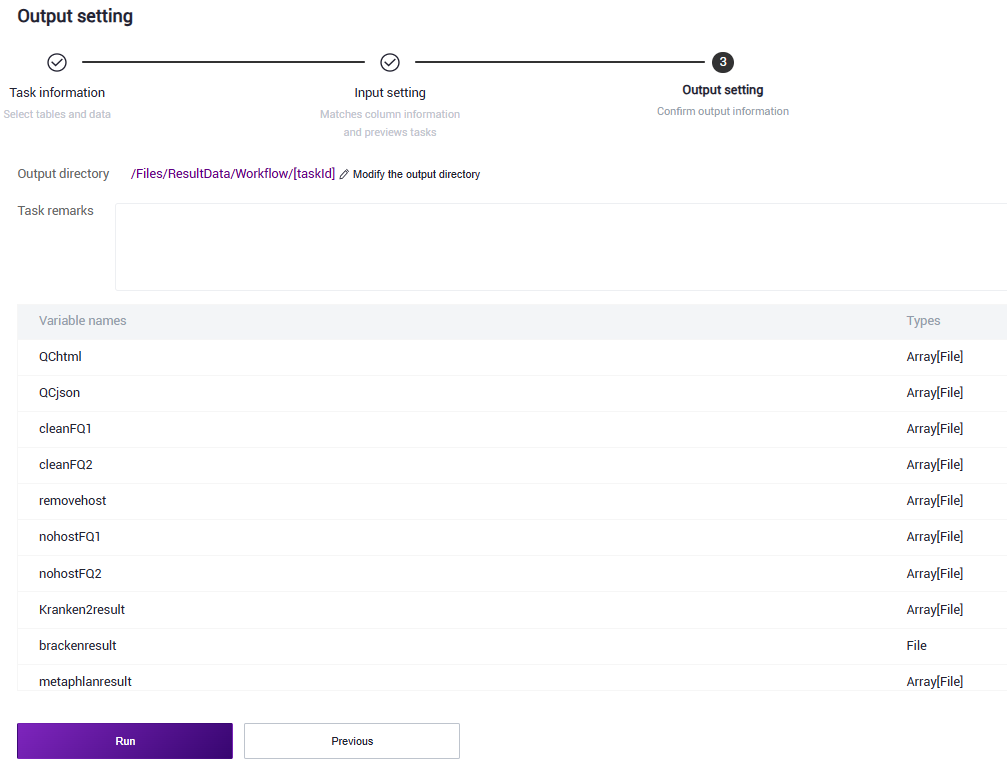
Figure 3.13 Start analysis
Usage Scenario 2: Table Submission
The operation includes five steps: uploading data, constructing a host reference genome (optional), downloading the sample template, filling in and importing the sample template, and starting the analysis. After importing the sample template, tasks can be run in batches. When the customer sees the task status as completed, it means the task is completed, and the report section can be viewed (see section 3.4 for details).
Step 1: Upload Data
Same as step 1 in usage scenario 1 (manual submission) (see 3.2.1 Step 1: Upload Data for details).
Step 2: Construct Reference Genome (Optional)
Same as step 2 in usage scenario 1 (manual submission) (see 3.2.2 Step 2: Construct Host Reference Genome for details).
Step 3: Download Sample Information Entry Table
- Click 【Data】 on the navigation bar, select 【Table】-【Download】 (Figure 3.14), click 【Workflow template】, and select the MSAP template for download.
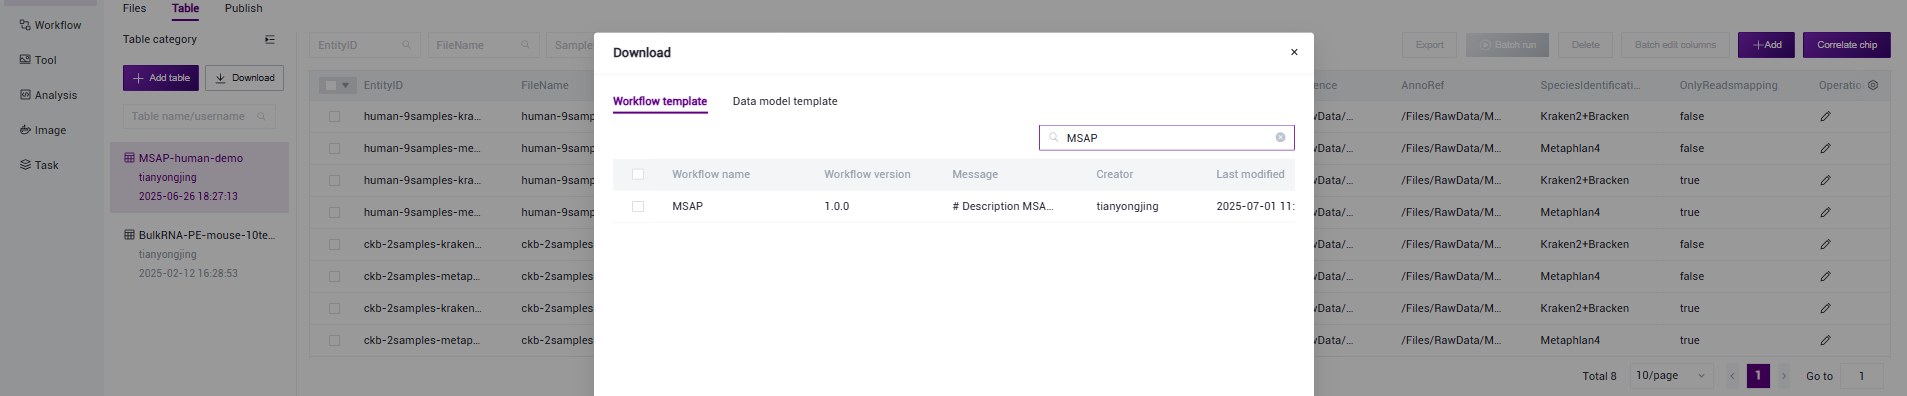
Figure 3.14 MSAP sample information template download navigation
- After opening, the MSAP sample template Excel is shown in Figure 3.15.
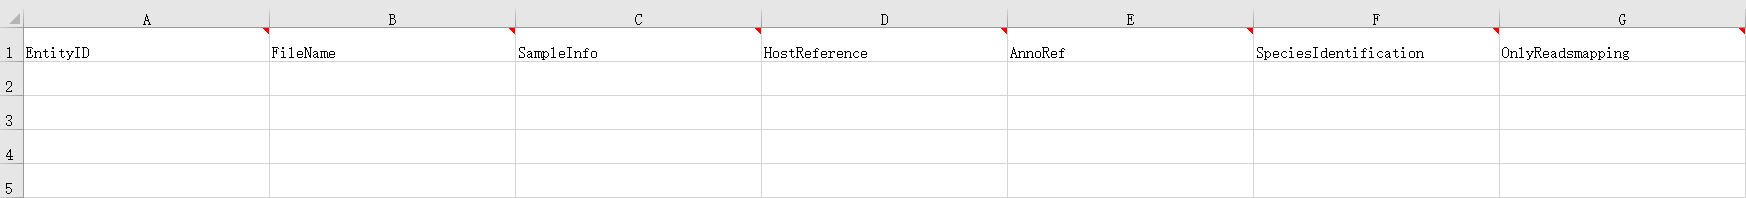
Figure 3.15 MSAP sample information template table
Step 4: Sample Information Import
- In this usage scenario, the sample import table needs to fill in the worksheet (Figure 3.15). This scenario means that after importing the table of the sequenced sample data, the analysis will start directly.
Notes for Excel
The imported file path must exist on the cloud platform. If the file does not exist, no task will be generated.
All parameters in the template are required fields. In the imported data, the required fields cannot be empty.
The EntityID in Excel must be unique.
Cells in Excel cannot be merged, and there cannot be spaces or special characters before or after the cell content.
Enter the analysis samples (Figure 3 - 16).
Meanings of each field in Excel
EntityID: The identification ID for associating tasks and data during the process analysis. It can be filled with the real ID required for analysis such as FileName. One EntityID corresponds to one task.
FileName: Prefix for the output file name.
SampleInfo: A table containing the sample name (SampleName), sample sequencing files (FQ1 and FQ2), and grouping information (Group). It should be filled in by the user in Excel, saved as a CSV format, and uploaded to the data management. The sample name should consist of English letters, numbers, and underscores. Samples with the same name are considered the same sample, and all FQ files will be analyzed together. The path of the sample sequencing files should be an absolute path rather than a relative path. For paired - end sequencing data, fill in FQ1 and FQ2 respectively. Single - end sequencing data is not supported. The absolute path on the DCS cloud platform is shown in the following figure:
Hover the mouse over the 🔗 symbol next to the file, copy the file path in the red box, and enter it into FQ1 or FQ2 in the table. Grouping is recommended to have biological replicates and should consist of English letters, numbers, and underscores.
HostReference: The reference genome index file of the host. If it is independently constructed in step 2 (3.2.2 Construct Host Reference Genome), select the host_genome.mmi file in the minimap2-index directory of the Task ID folder.
AnnoRef: The Metagenome-assembled-genomes-reference folder in the public database (it needs to be copied from the public library Metagenome_assembled_genomes_reference to the data management of the project) for species and functional annotation.
SpeciesIdentification: The tool for species identification, only supporting MetaPhlan4 or Kraken2. Only Kraken2+Bracken or MetaPhlan4 can be filled in. The default is Kraken2+Bracken.
OnlyReadsmapping: Whether to only run the read - based analysis step. The default is false, which means running both the read - based analysis and the assembly - based analysis.
After filling in, it is shown in Figure 3.16:
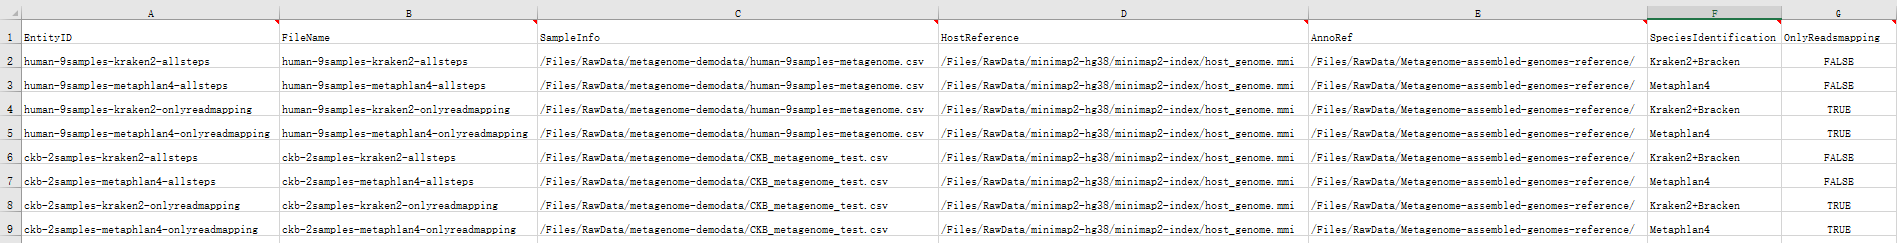
Figure 3.16 Fill in the sample template (sample information entry)
- After configuring the Analysis Sample Entry worksheet of the sample template, return to the 【Data】 interface and click 【Table】-【+Add table】 (Figure 3.17).
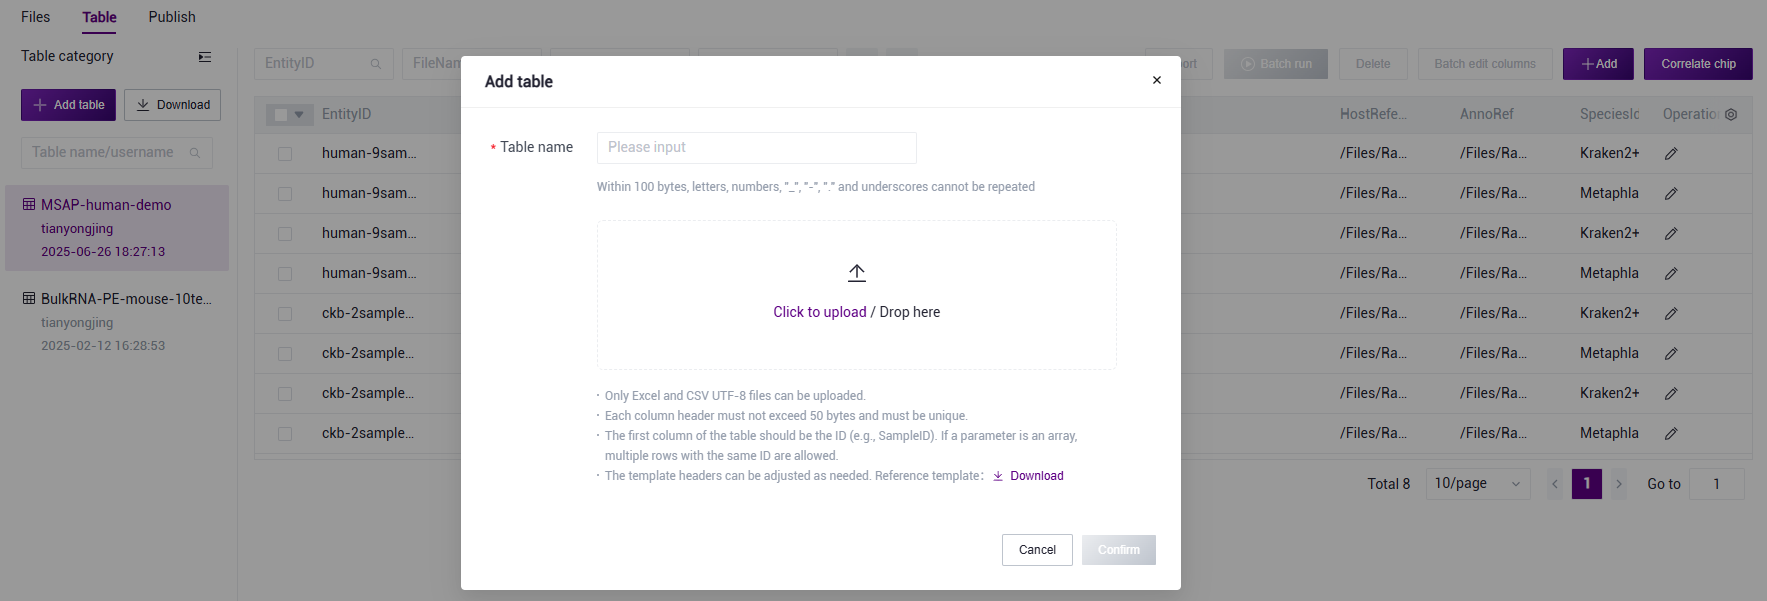
Figure 3.17 Sample information import step one
- Click 【Click to upload/ Drop here】 to browse and select the filled - in sample information table, and click 【confirm】 (Figure 3.18). After the upload is completed, the file will be displayed in the target folder.
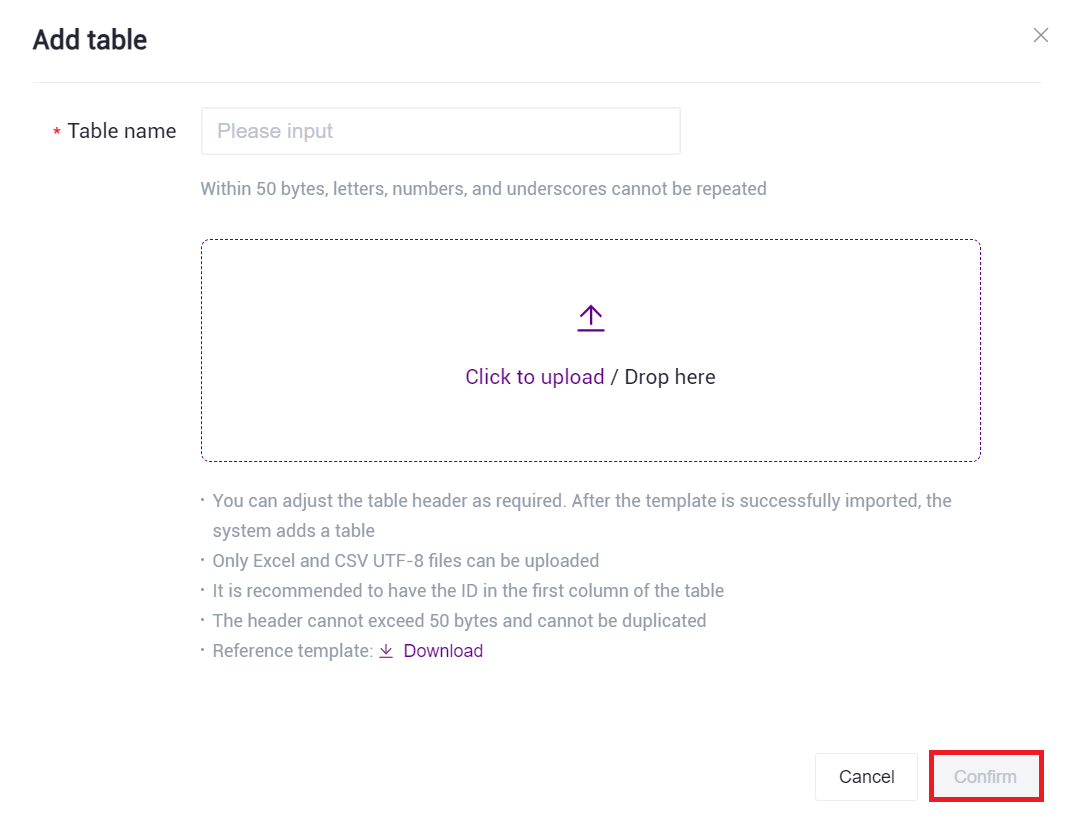
Figure 3.18 Sample information import step two
- Click 【Workflow】 on the navigation bar to enter the process analysis page. Enter MSAP in the search box and click 【Run】 (Figure 3.19).
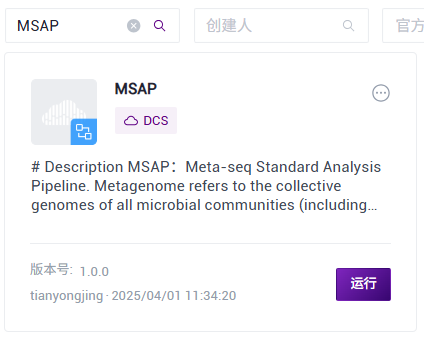
Figure 3.19 Sample information import step three
- Select Run workflow(s), click on Please select table, select the table imported in subsection 3) of this section (Figure 3 - 20), select the required rows, and click 【Next】 (Figure 3.21).
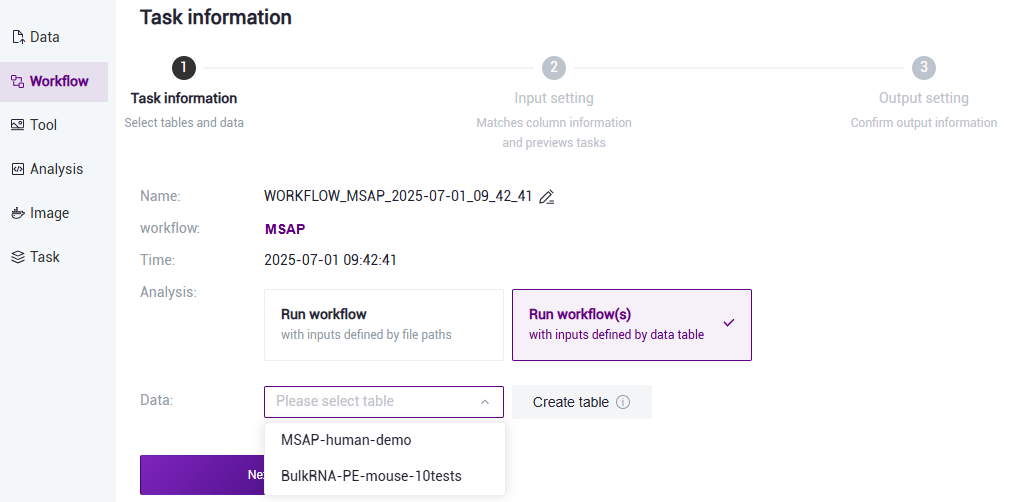
Figure 3.20 Sample information import step four
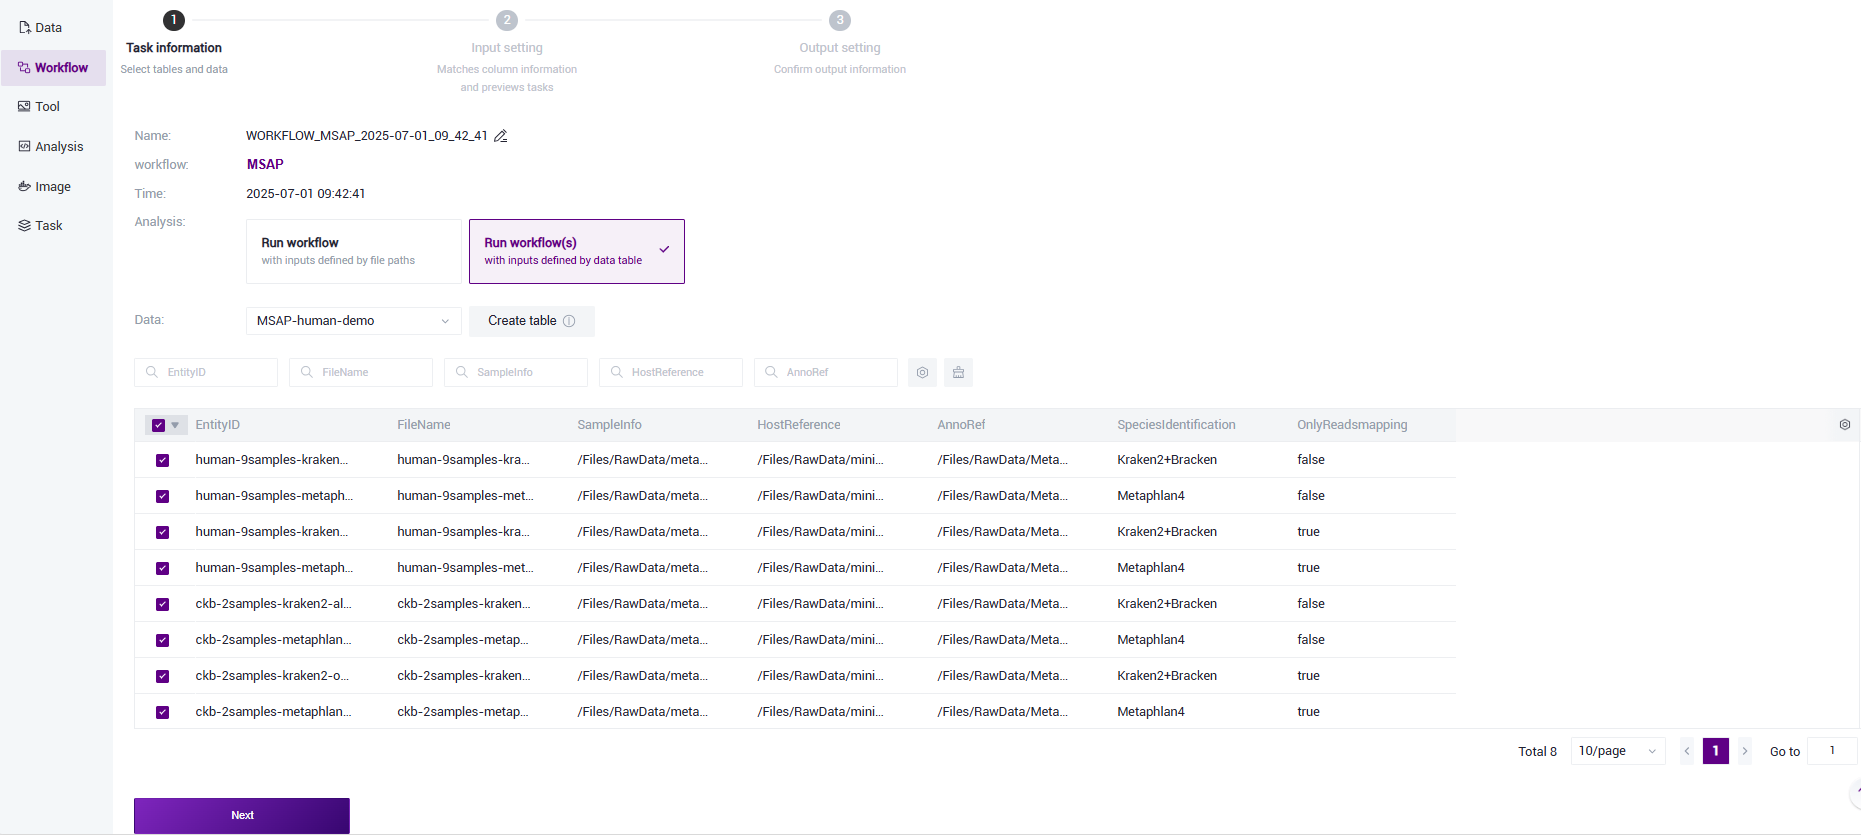
Figure 3.21 Sample information import step five
- The Values are usually automatically filled. You only need to check if the filling is correct. If you need to modify, click at Values and select the corresponding value (Figure 3.22).
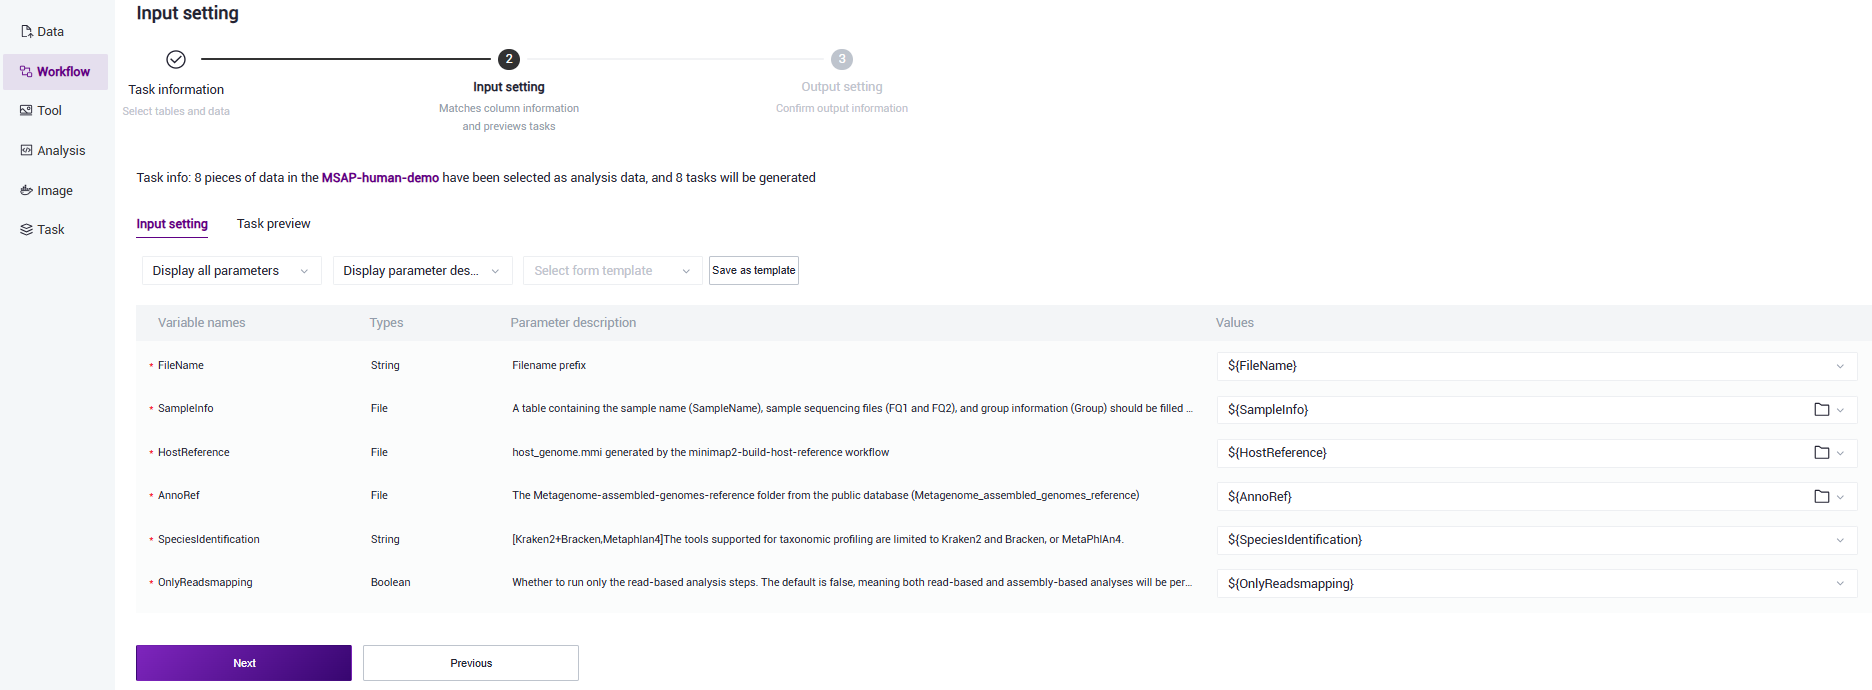
Figure 3.22 Sample information import step six
Step 5: Start Analysis
Click 【Run】 to start the analysis (Figure 3.22).
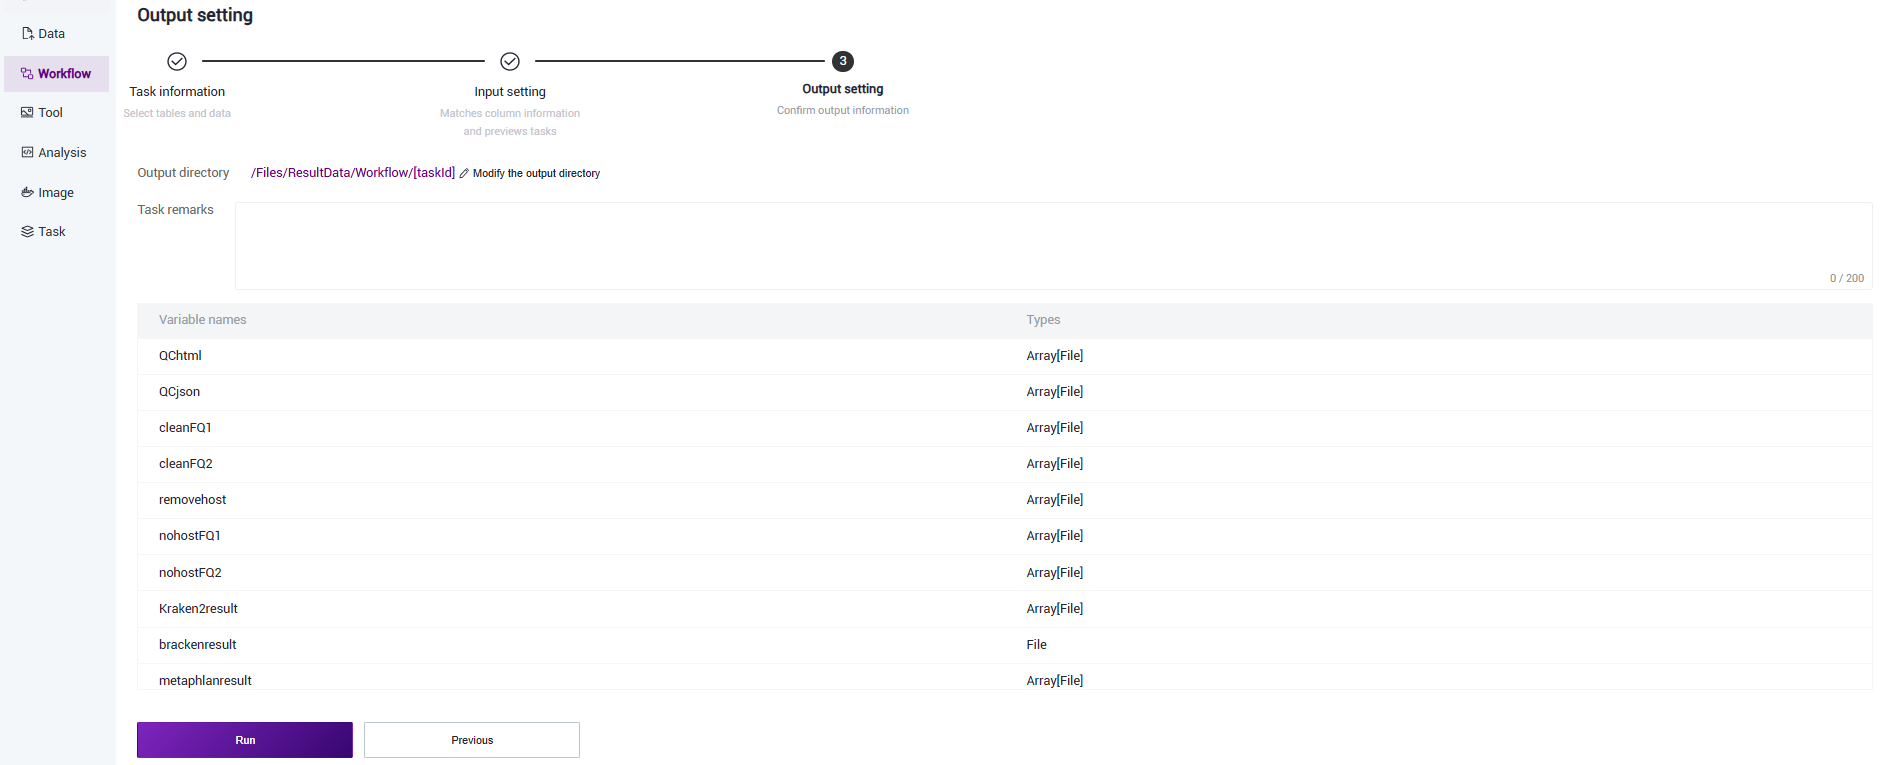
Figure 3.22 Start analysis
Report Viewing and Result File Download
Report Viewing
Click 【Task】 on the navigation bar. When the task status shows completed, it means the task is completed. Click 【Detail】 to view the result section (Figure 3.23). Click 【View the results catalog】 to jump to the generated result file directory (Figure 3.24).
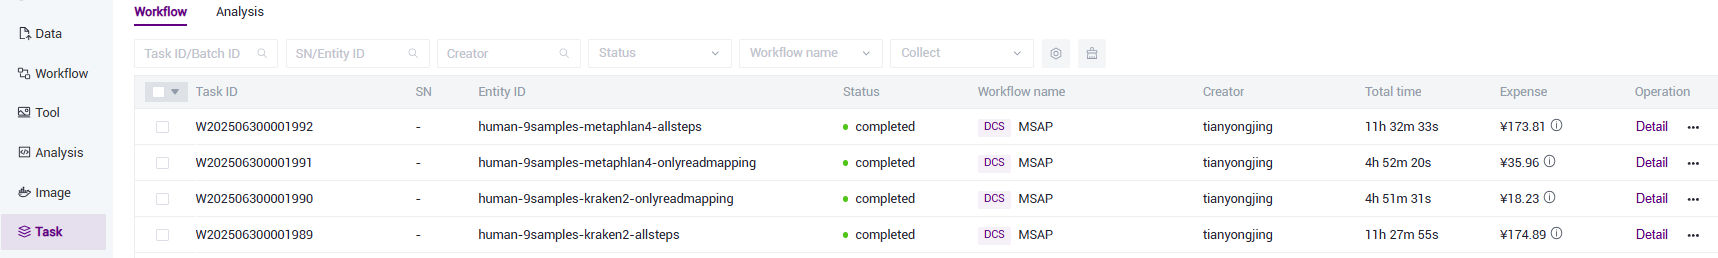
Figure 3.23 Result viewing one
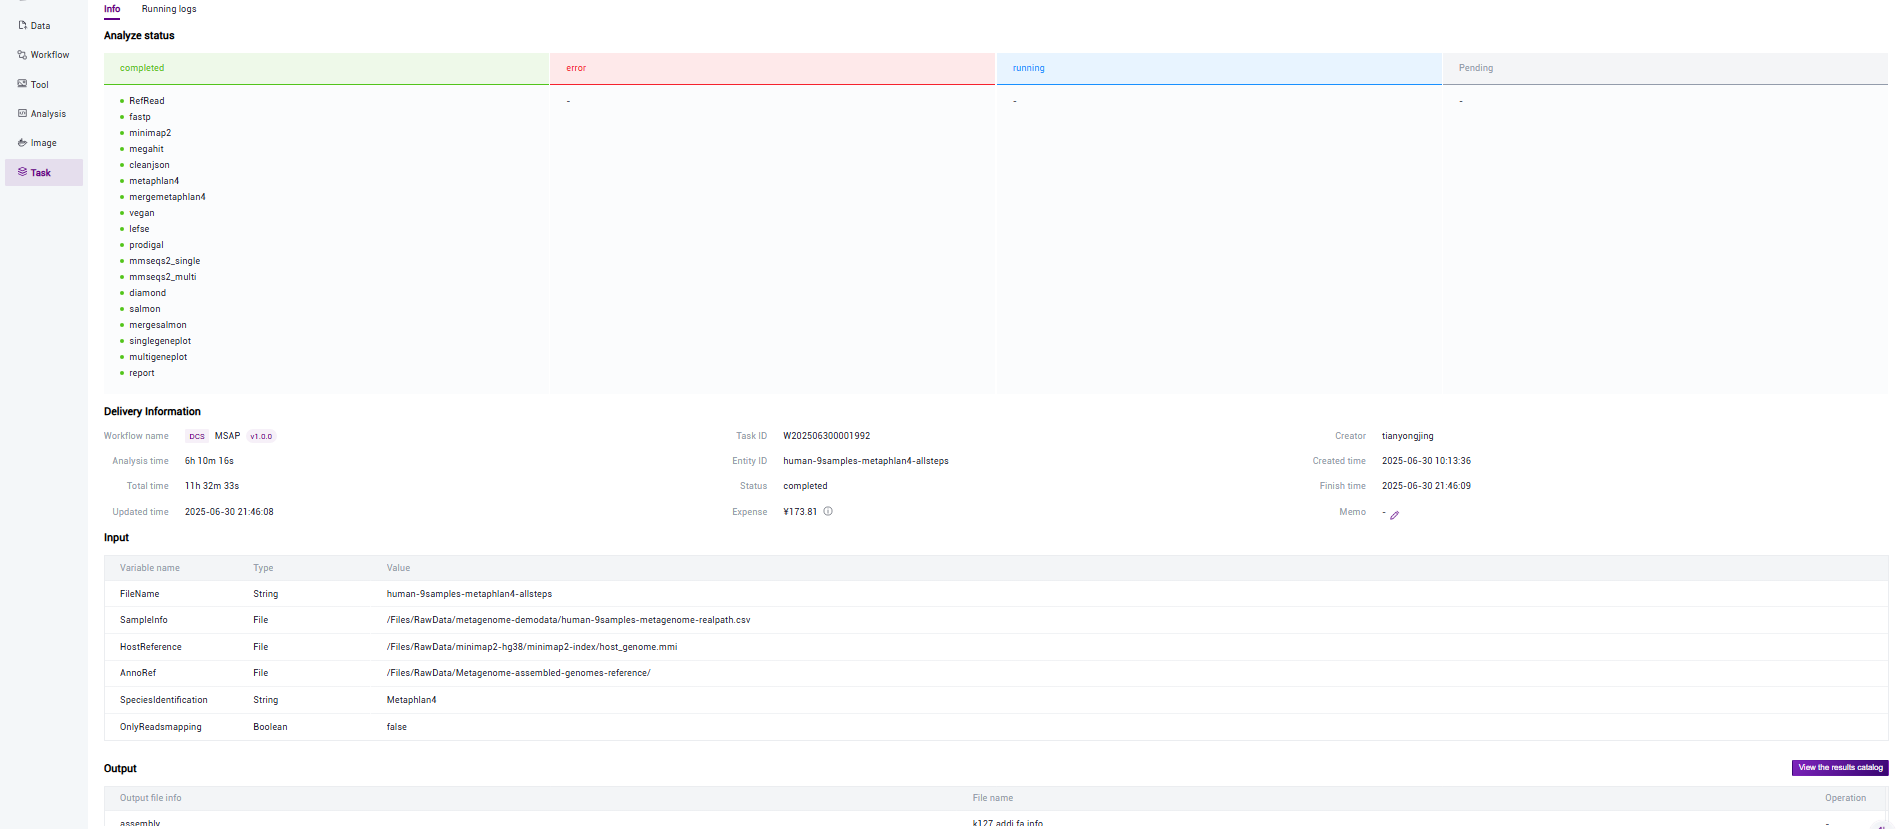
Figure 3.24 Result viewing two
Report Download
- Click 【Data】 on the navigation bar to enter the data management page. Search according to the Task ID of the task and click to enter the Task ID folder (Figure 3.25).
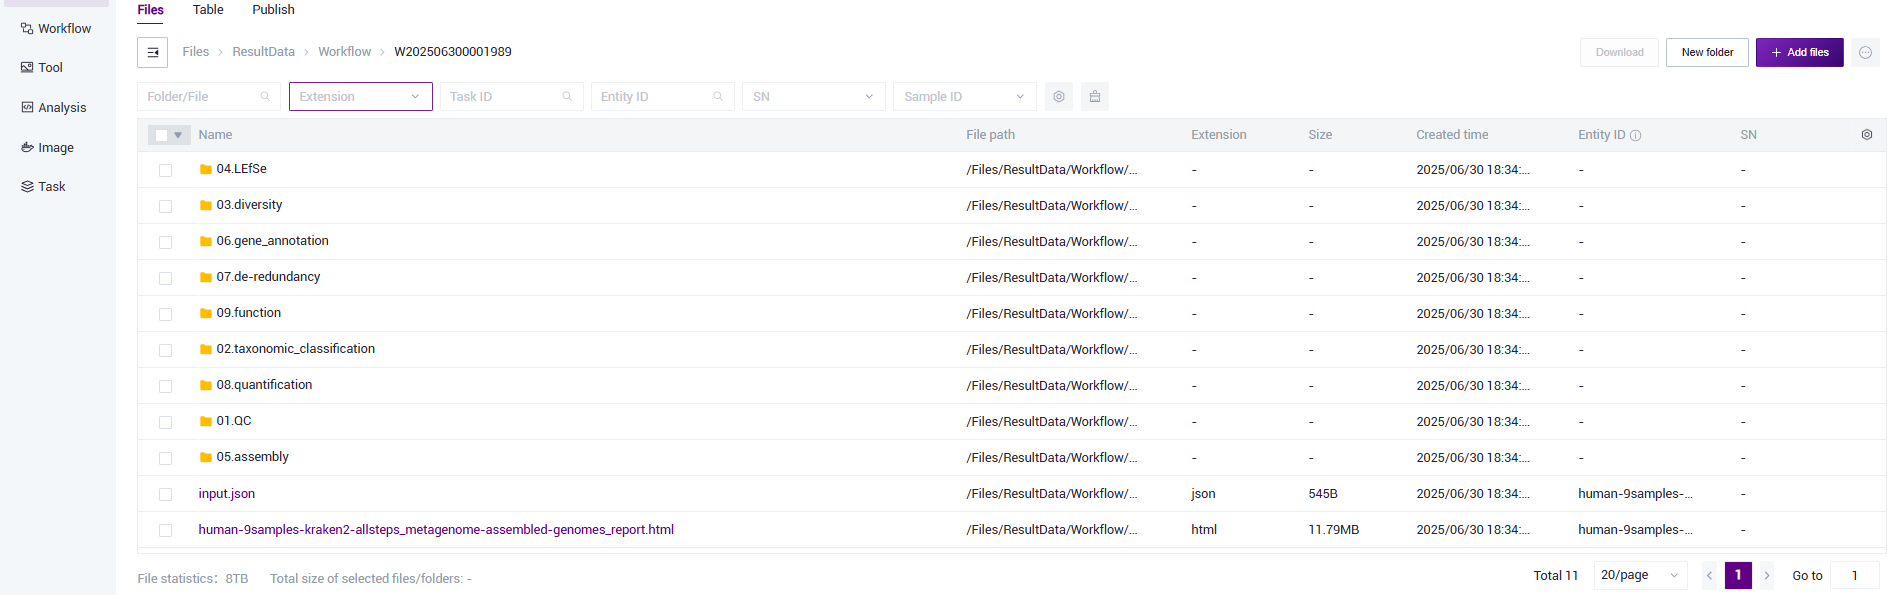
Figure 3.25 Report download step one
- Select the *report.html file and click 【Download】-【Web download】 (Figure 3.26).
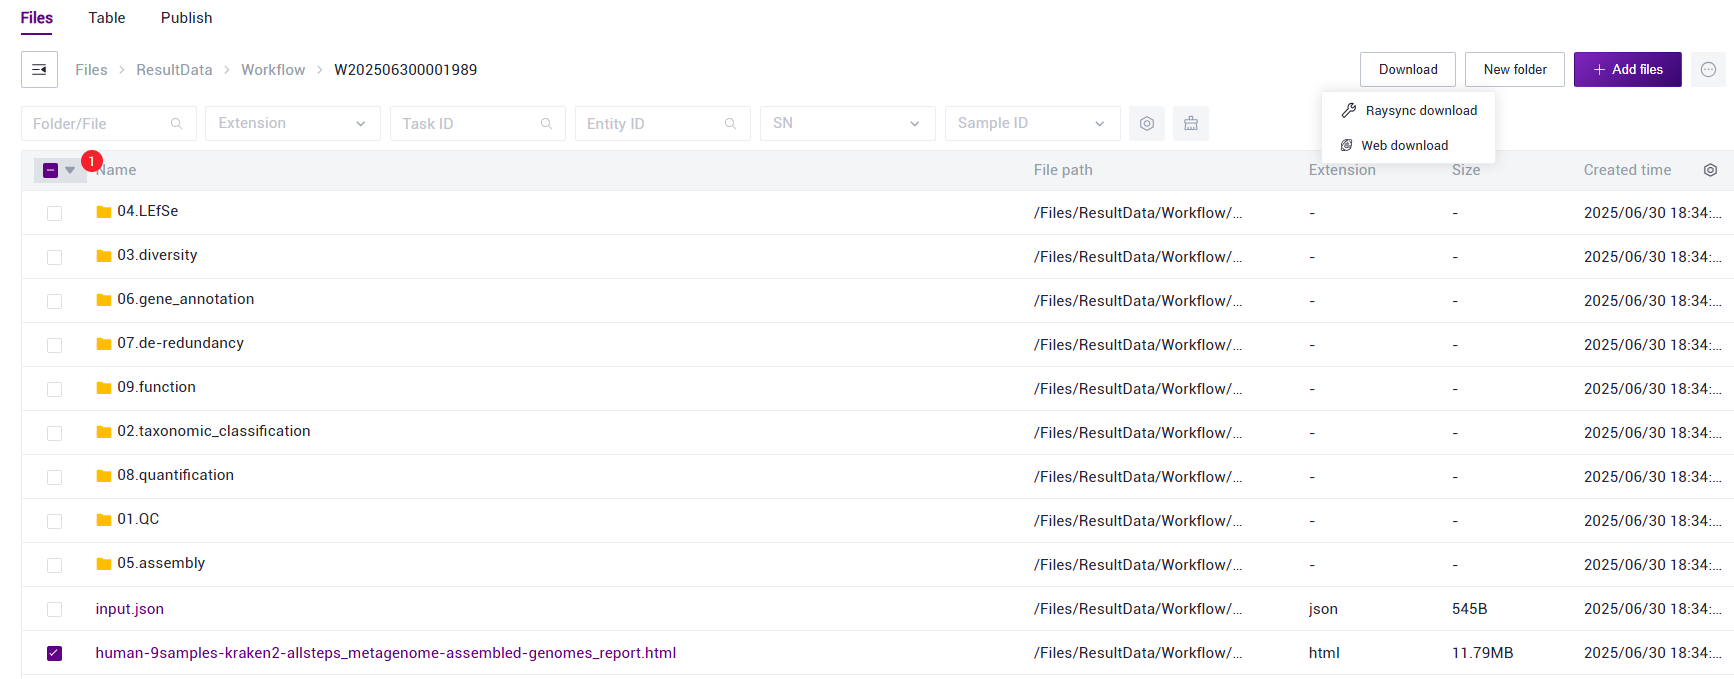
Figure 3.26 Report download step two
Result Display
MSAP Sample Report Display
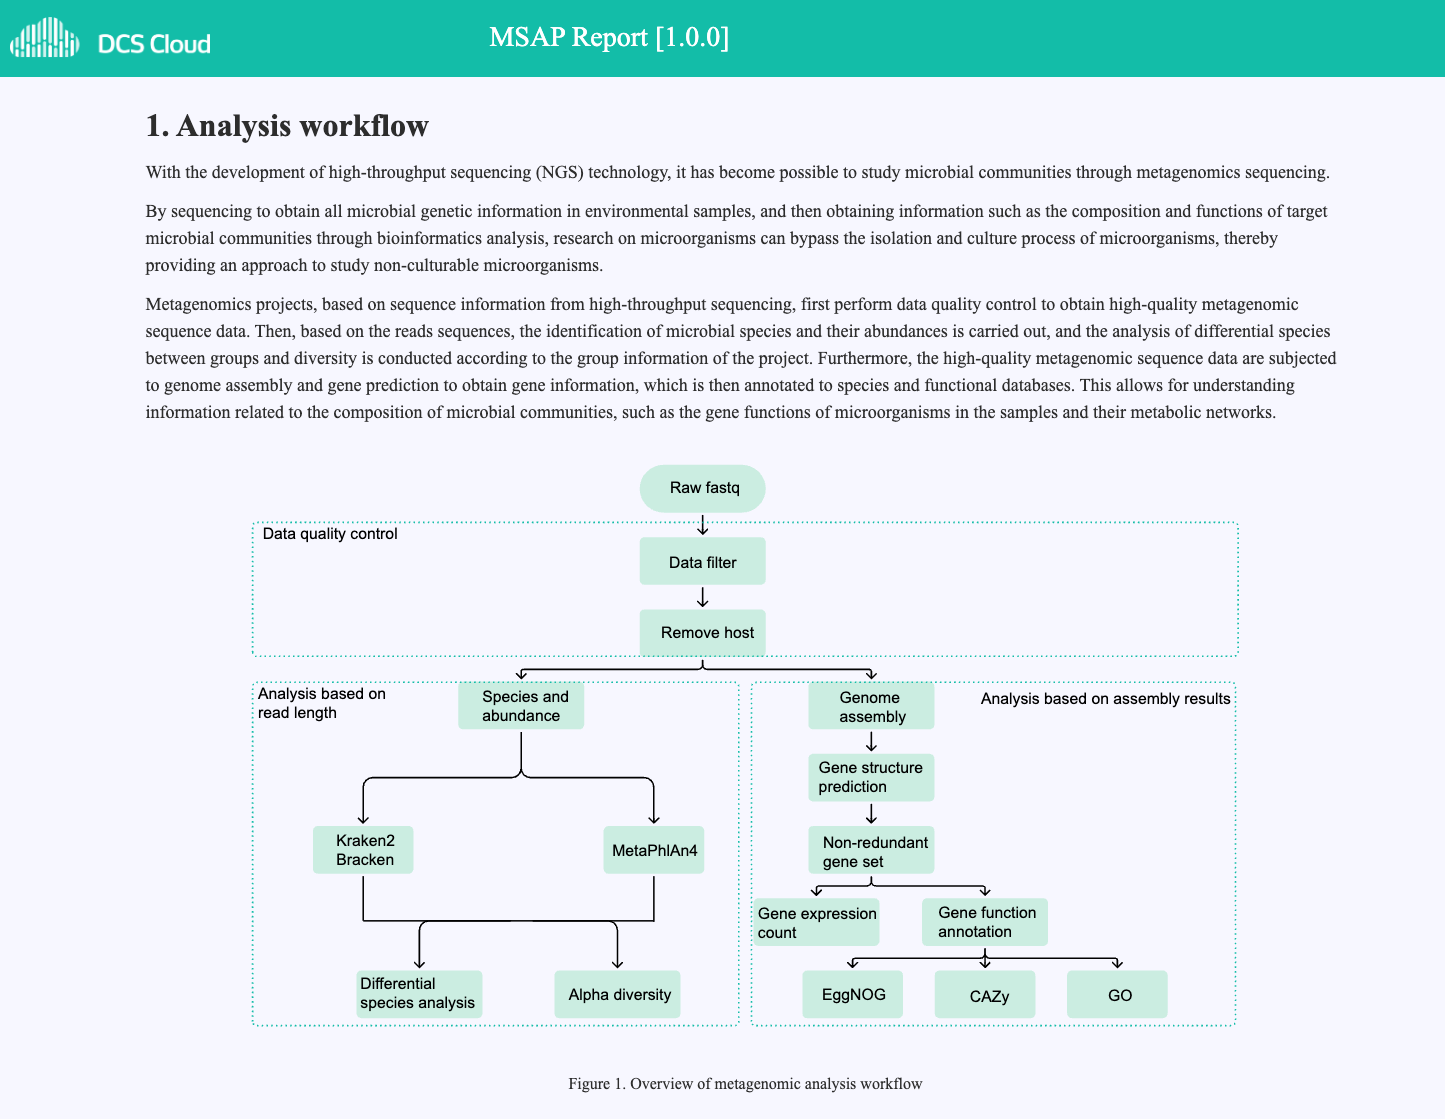
Figure 4.1 Overview of metagenomic analysis workflow
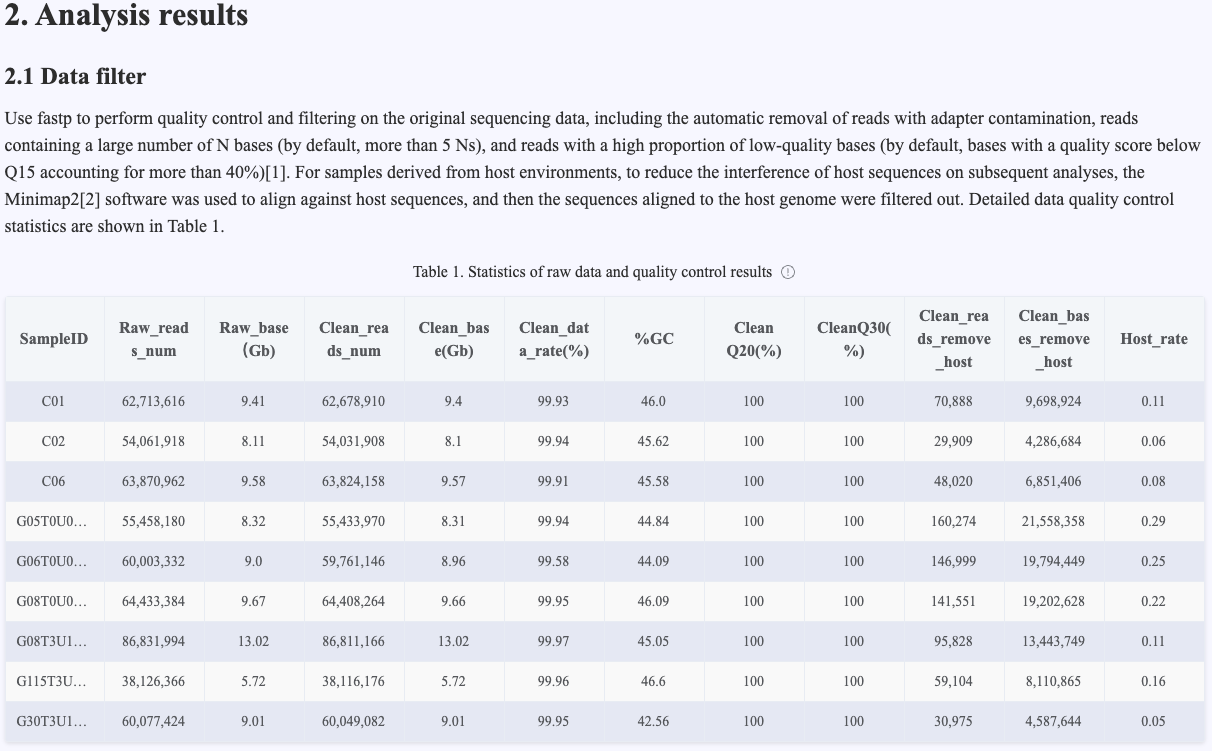
Figure 4.2 Data quality control results
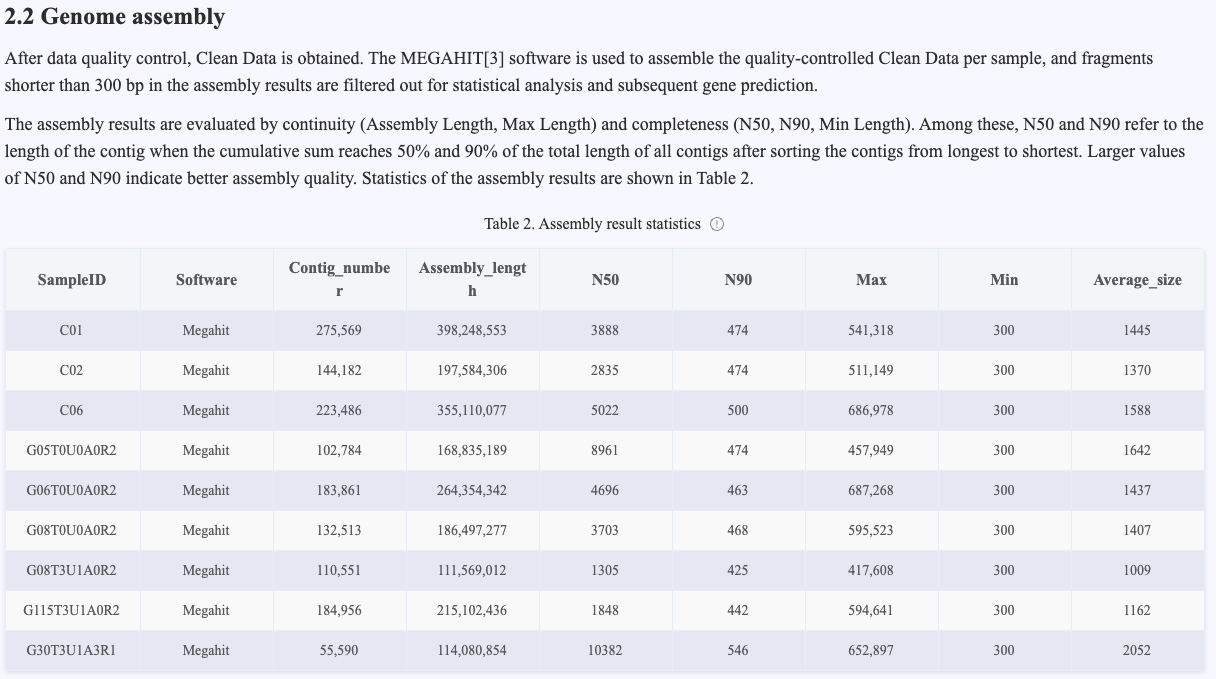
Figure 4.3 Assembly results
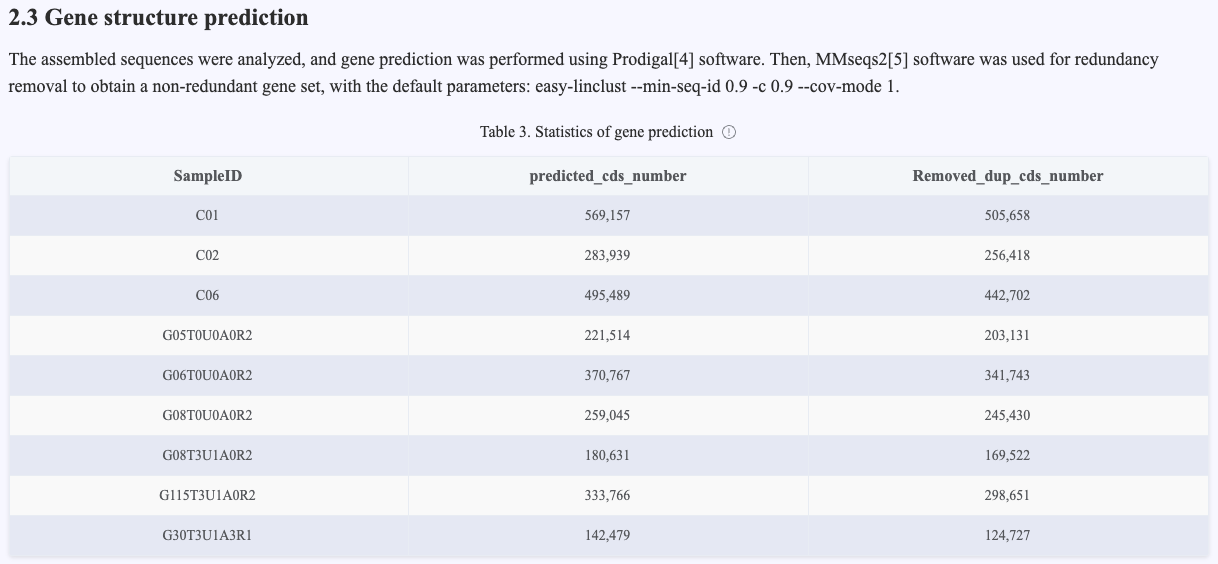
Figure 4.4 Gene prediction results
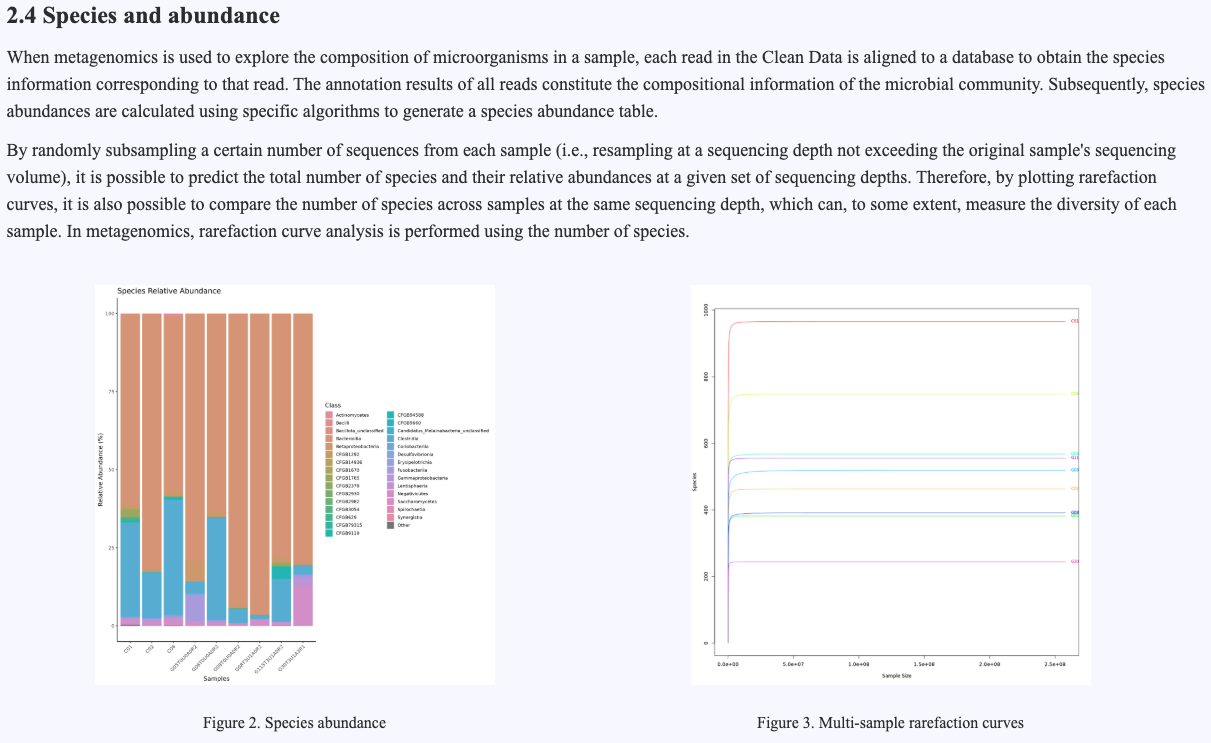
Figure 4.5 Species annotation results
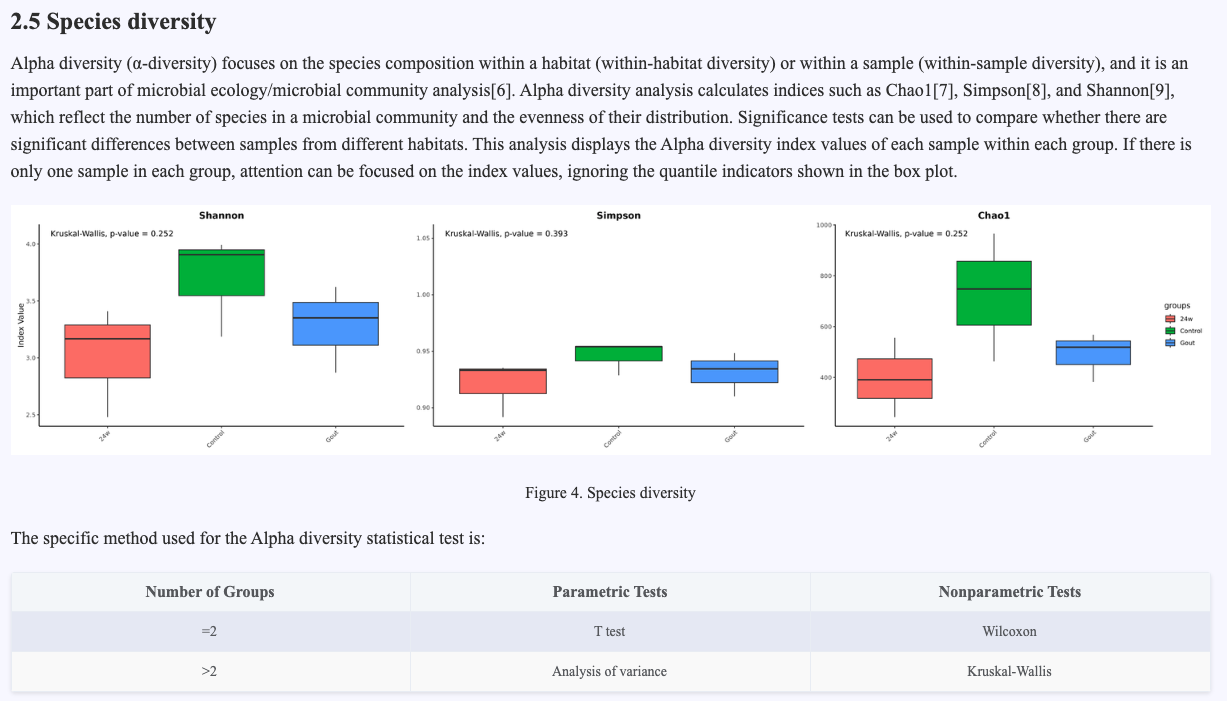
Figure 4.6 Species diversity analysis
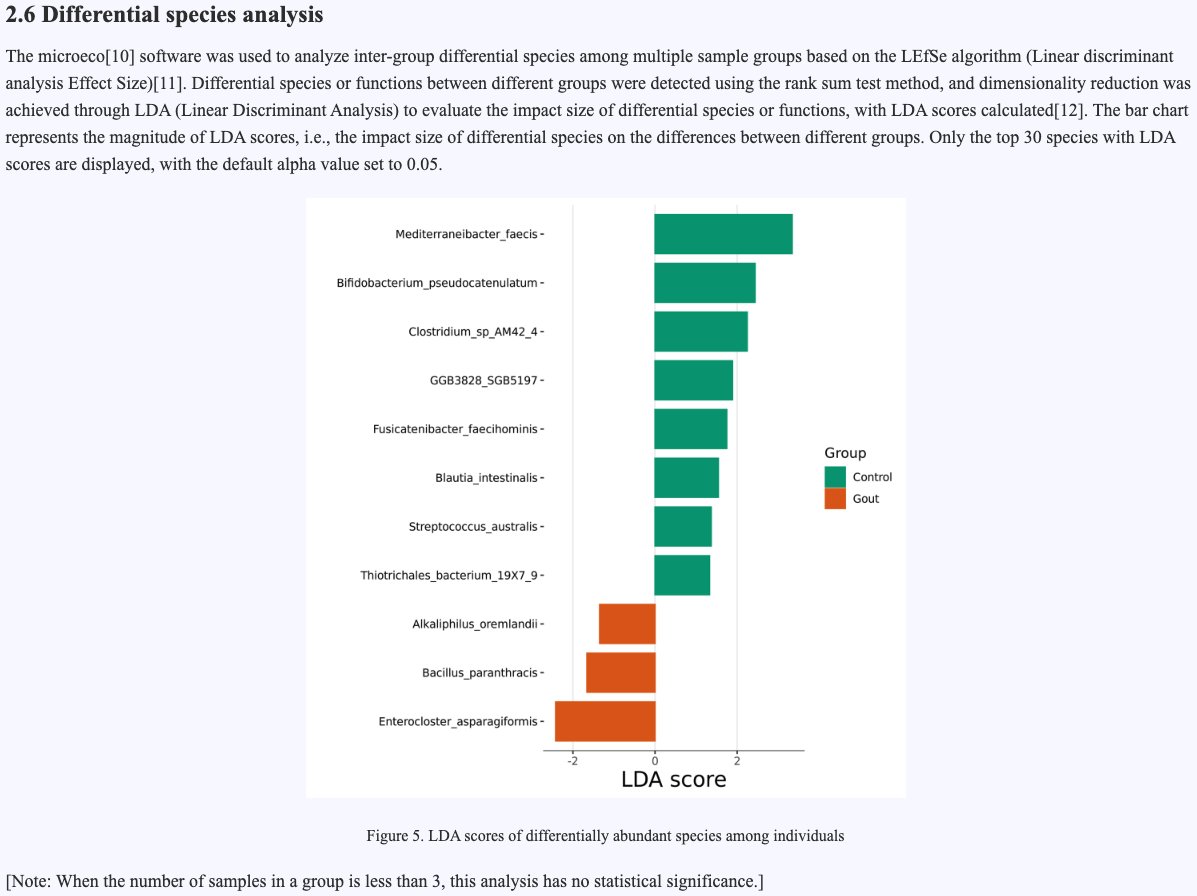
Figure 4.7 LDA scores of differentially abundant species among individuals
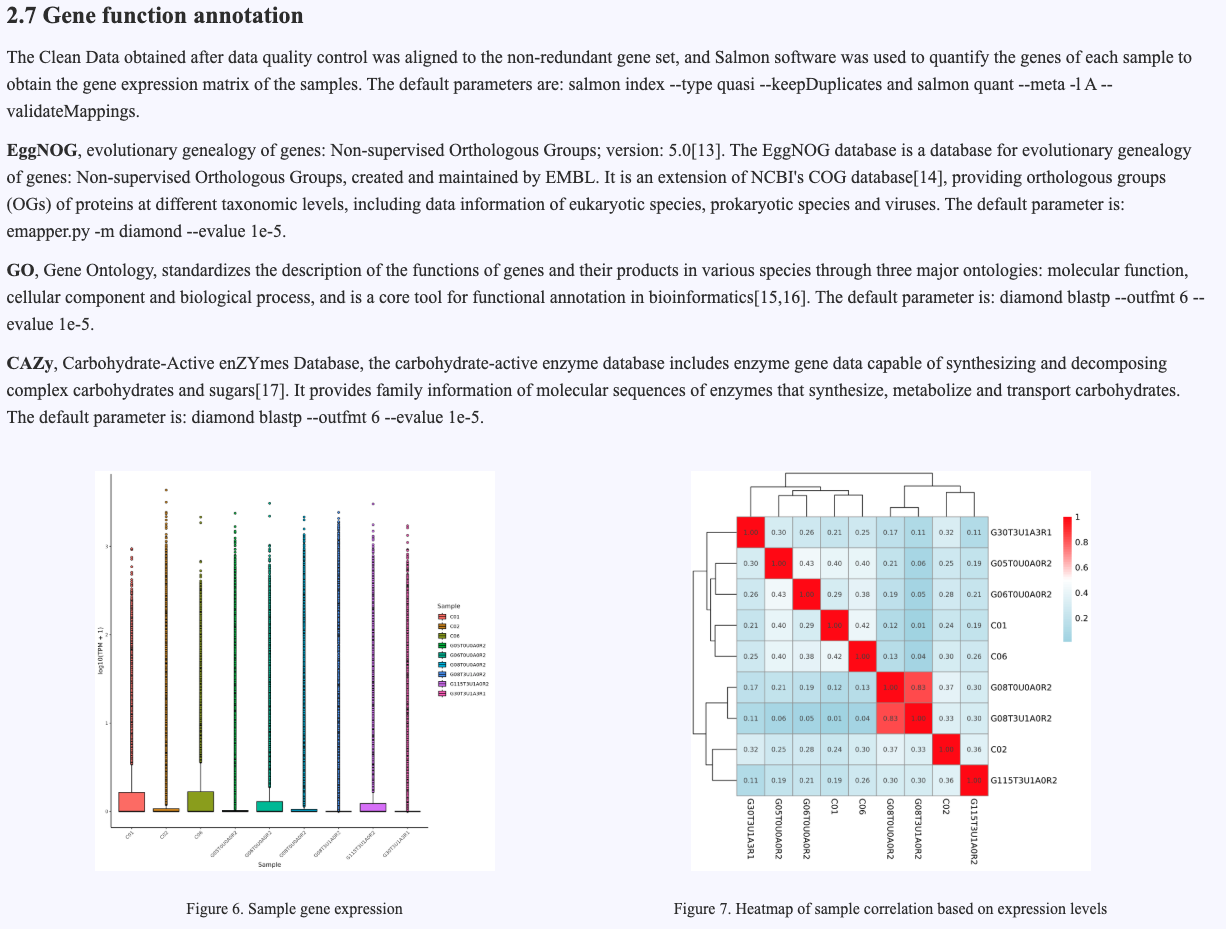
Figure 4.8 Gene expression statistical information
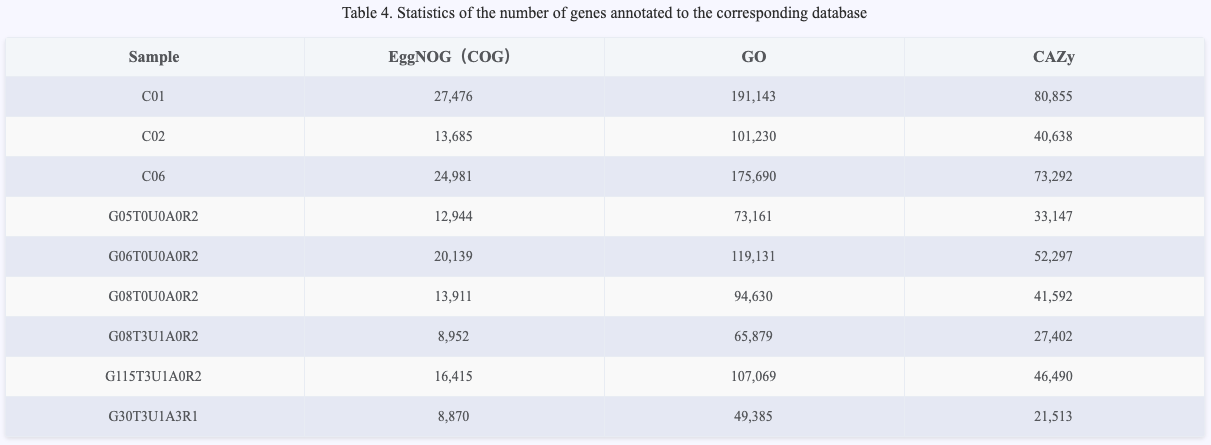
Figure 4.9 Gene annotation statistical information
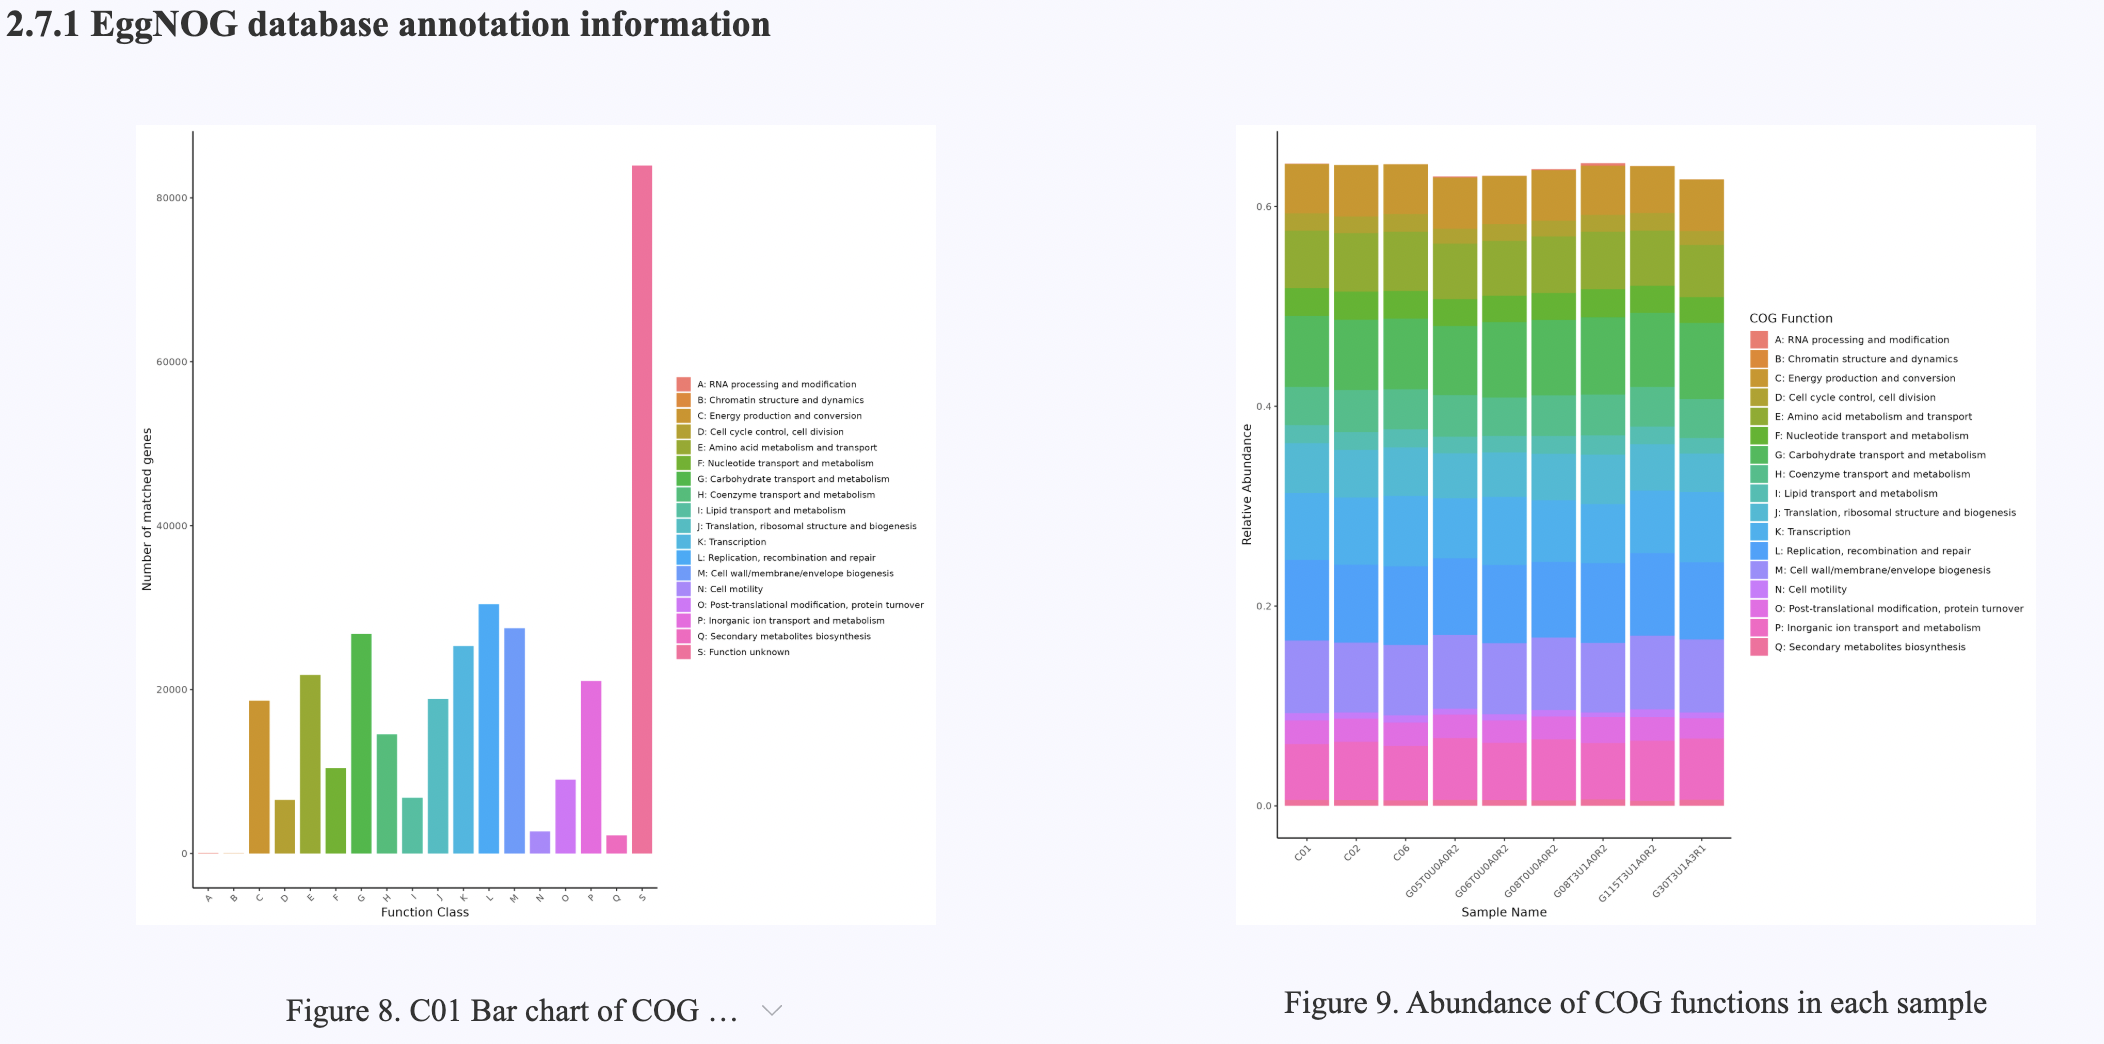
Figure 4.10 EggNOG database annotation information
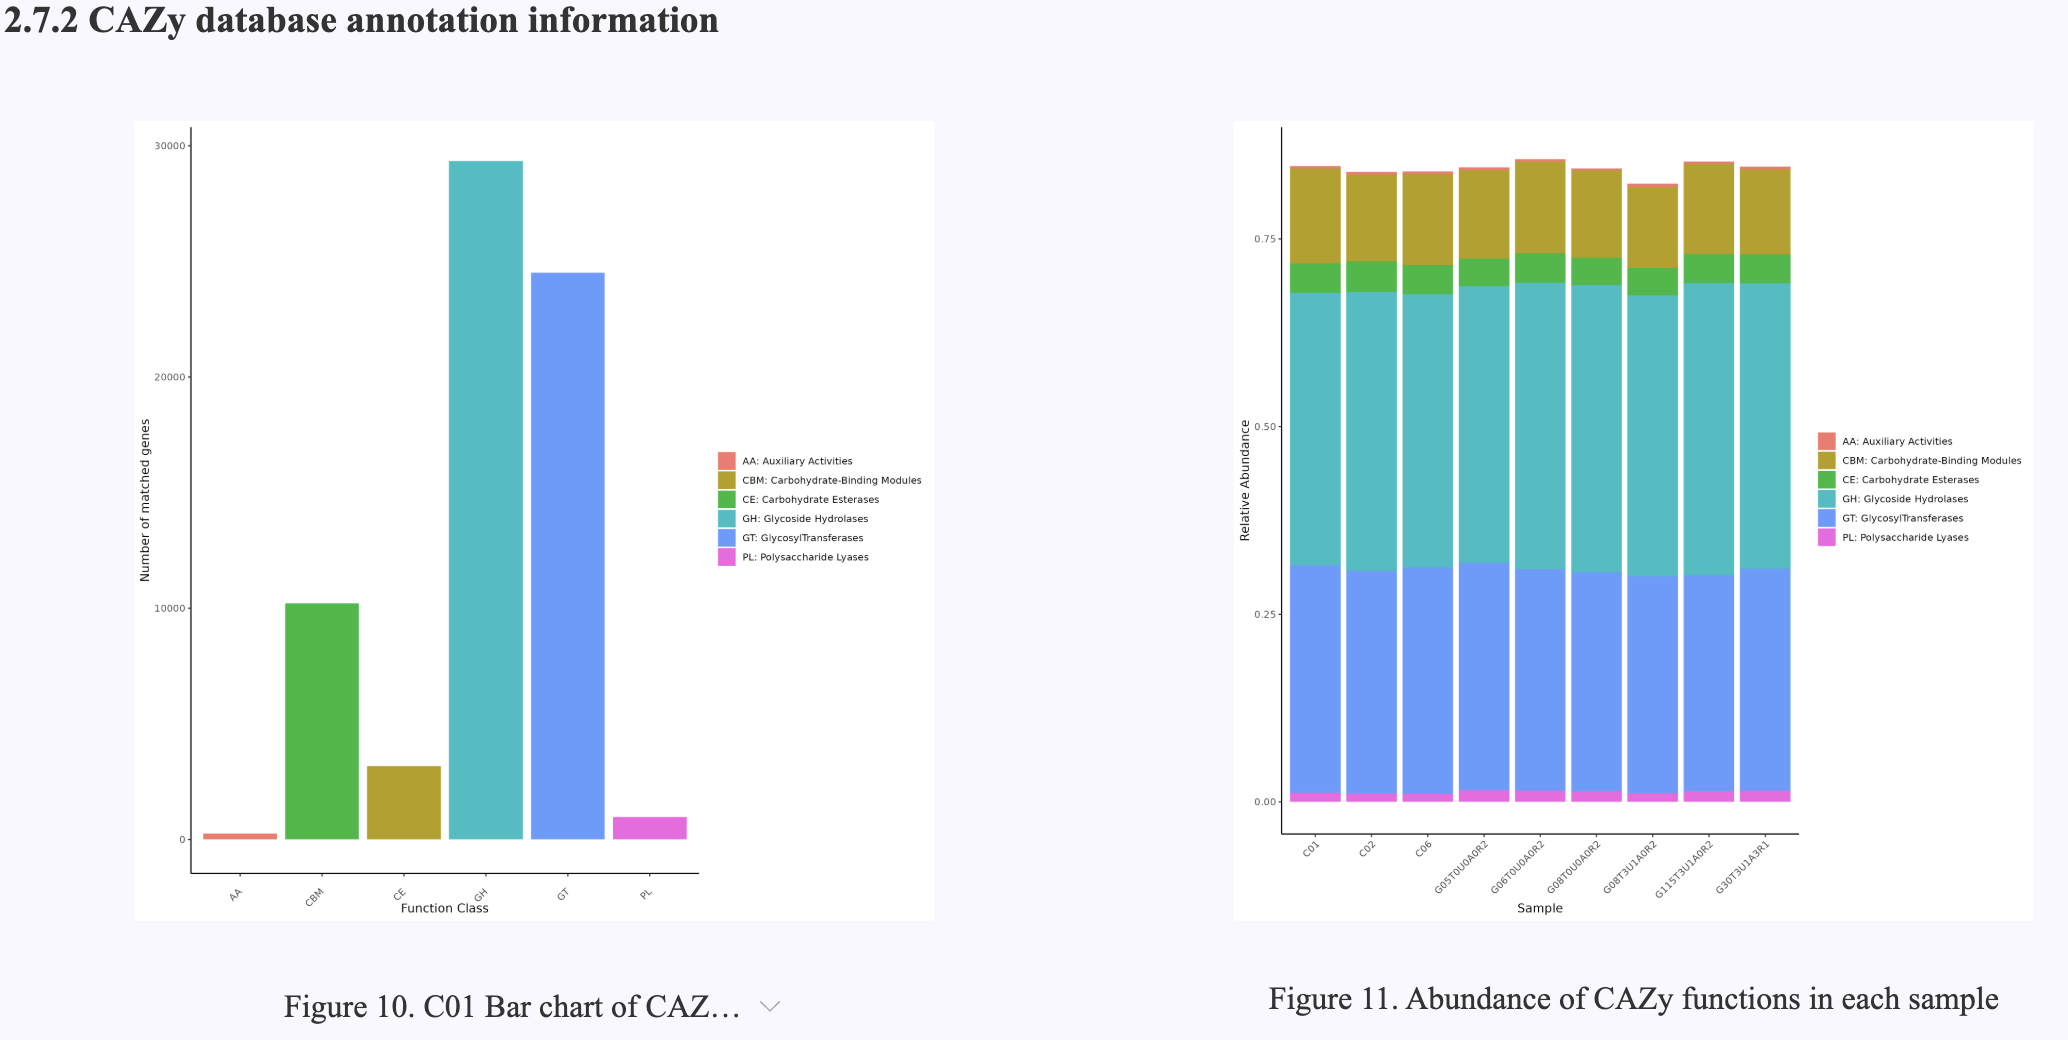
Figure 4.11 CAZy database annotation information
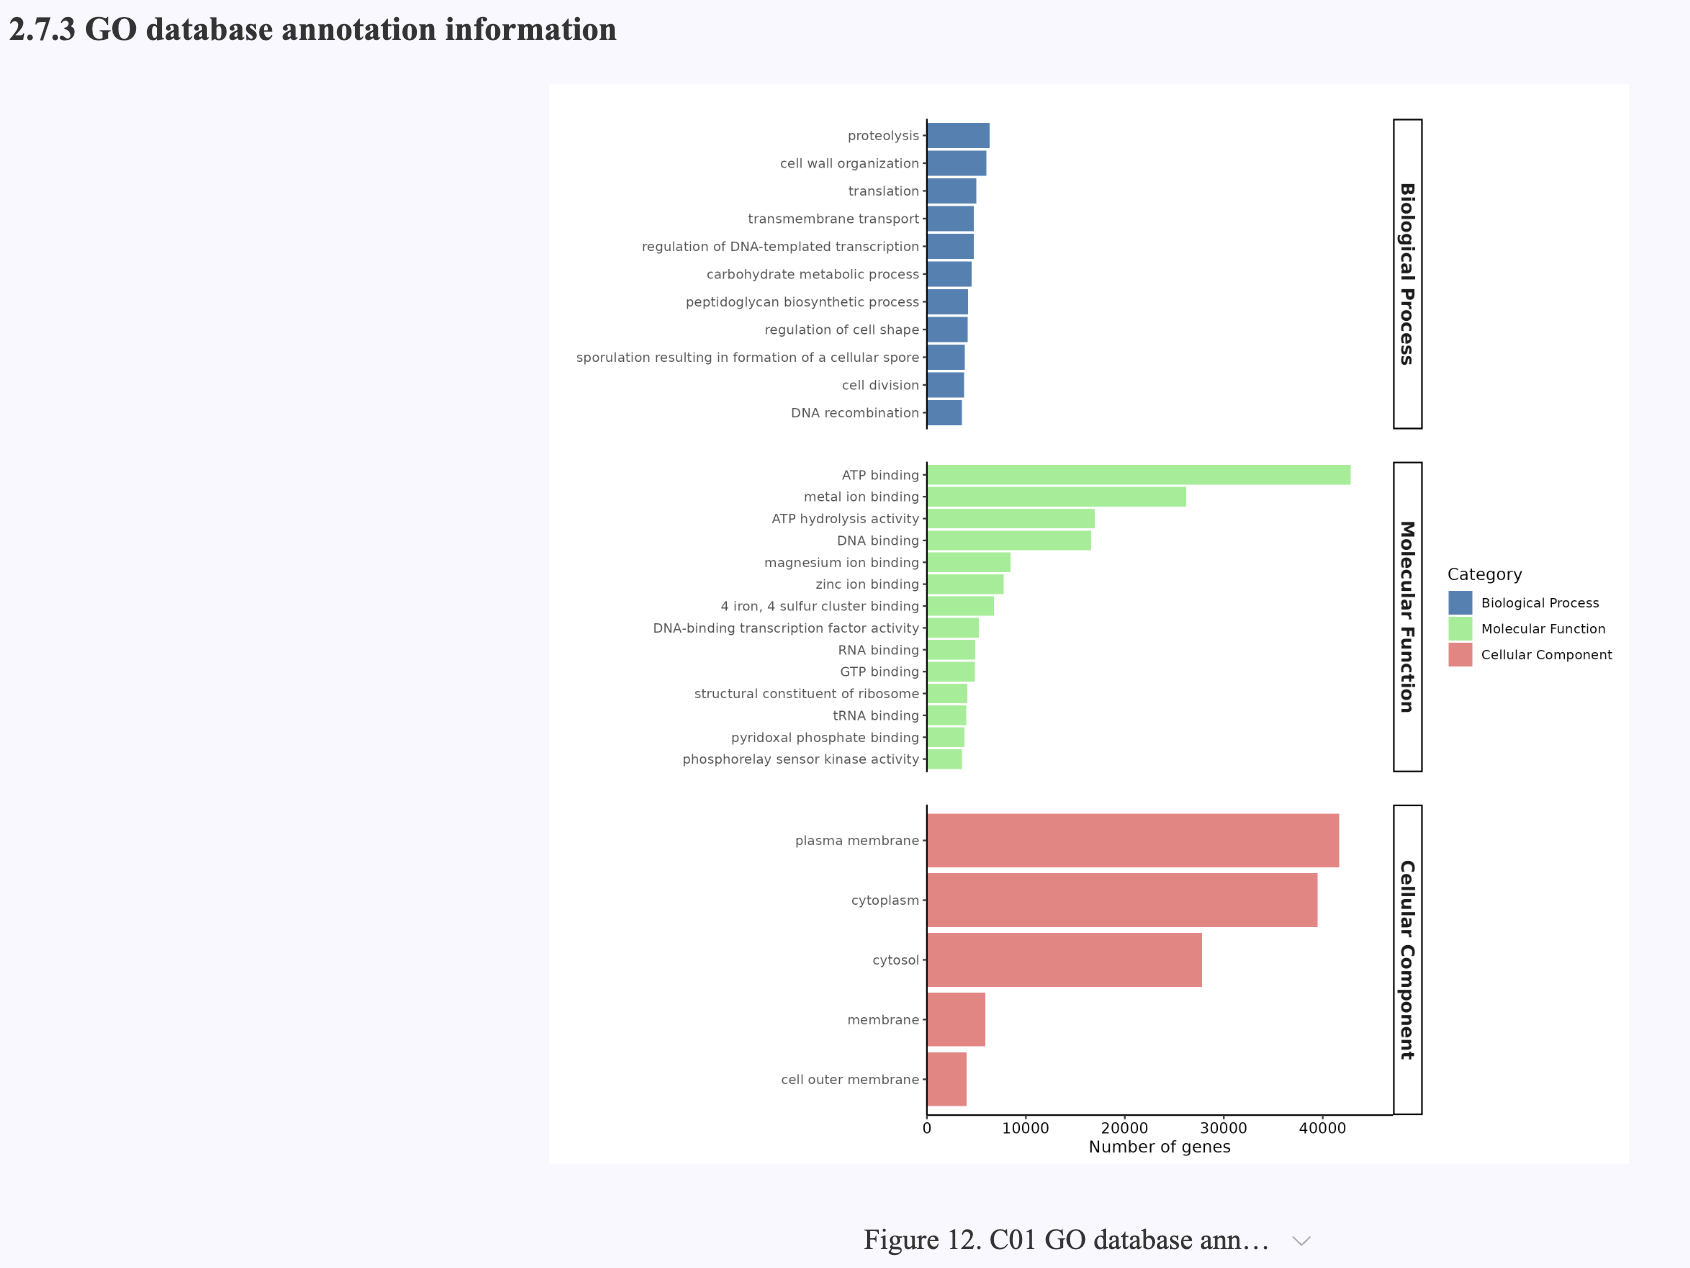
Figure 4.12 GO database annotation information
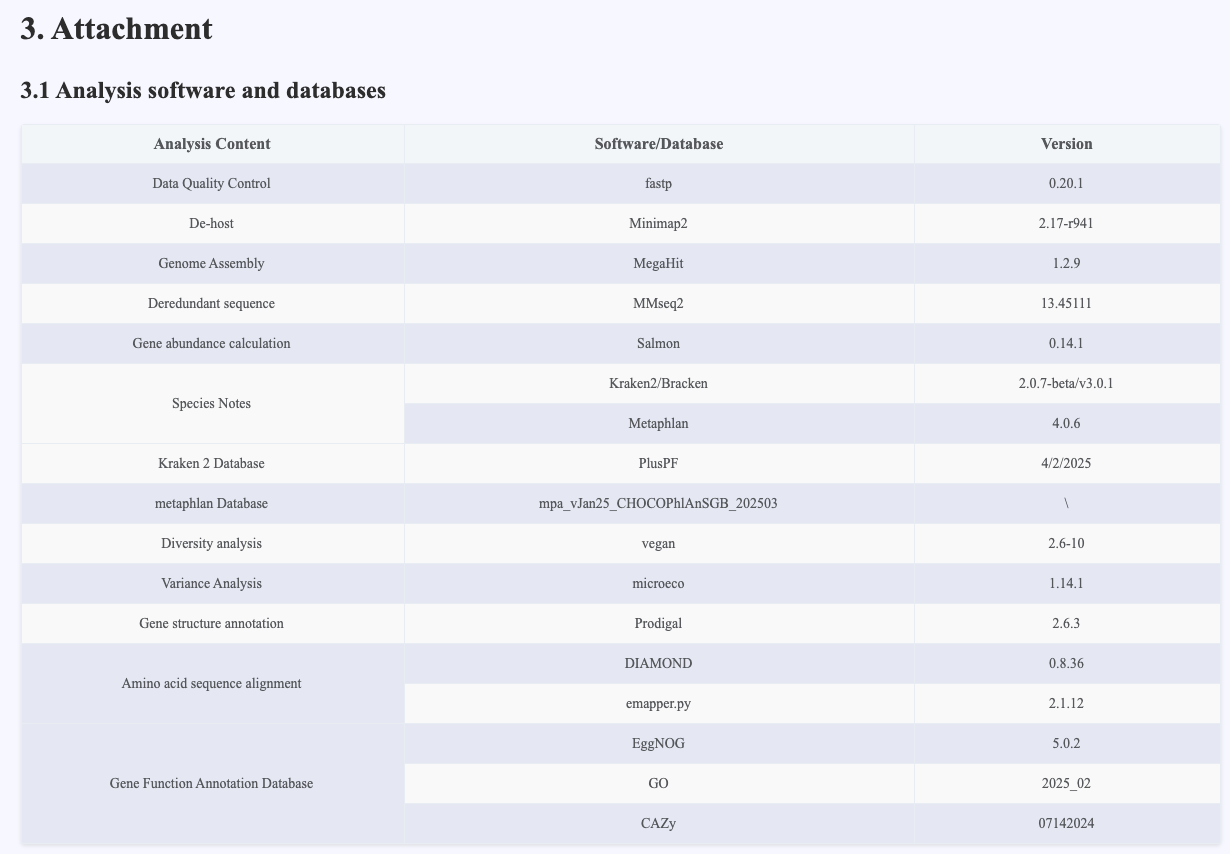
Figure 4.13 Analysis software and database information