
Function Introduction
Pathology Cloud
This document is intended for pathologists and data annotators, helping you quickly get started with browsing, annotating, and managing digital pathology slides.
1. System Overview
URL: https://path.dcs.cloud/#/cases
The Pathology Annotation System is an online slide-reading and annotation platform designed for Whole Slide Images (WSI, full-field digital slides). Its core capabilities include:
- Case Library Management: Create cases, enter pathology information, and associate and upload slide files.
- Multi-format Slide Viewing: Supports common pathology slide formats such as
.svs,.ome.tif,.tiff, and.ome.tiff, covering HE staining, immunohistochemistry (IHC), fluorescence (FL), and other types. - Fine-grained Annotation: Provides multiple graphic tools including rectangle, ellipse, line, polygon, polyline, and point annotations, with automatic calculation of measurements such as area.
- Annotation Attribute Management: Name each annotation, assign type labels (e.g., tumor, stroma, abnormal, with custom support), and add diagnostic notes.
- View Enhancement: Brightness, contrast, black-and-white inversion, rotation, and annotation opacity adjustment, along with overlay information such as scale bar and thumbnail.
- Report Preview: Preview the annotation results and pathology report of the current slide with one click.
2. Interface Overview
2.1 Case Library Main Interface (Patient Case Management)
Enter the "Case Library · Patient Case Management" list page, where all cases are centrally managed:
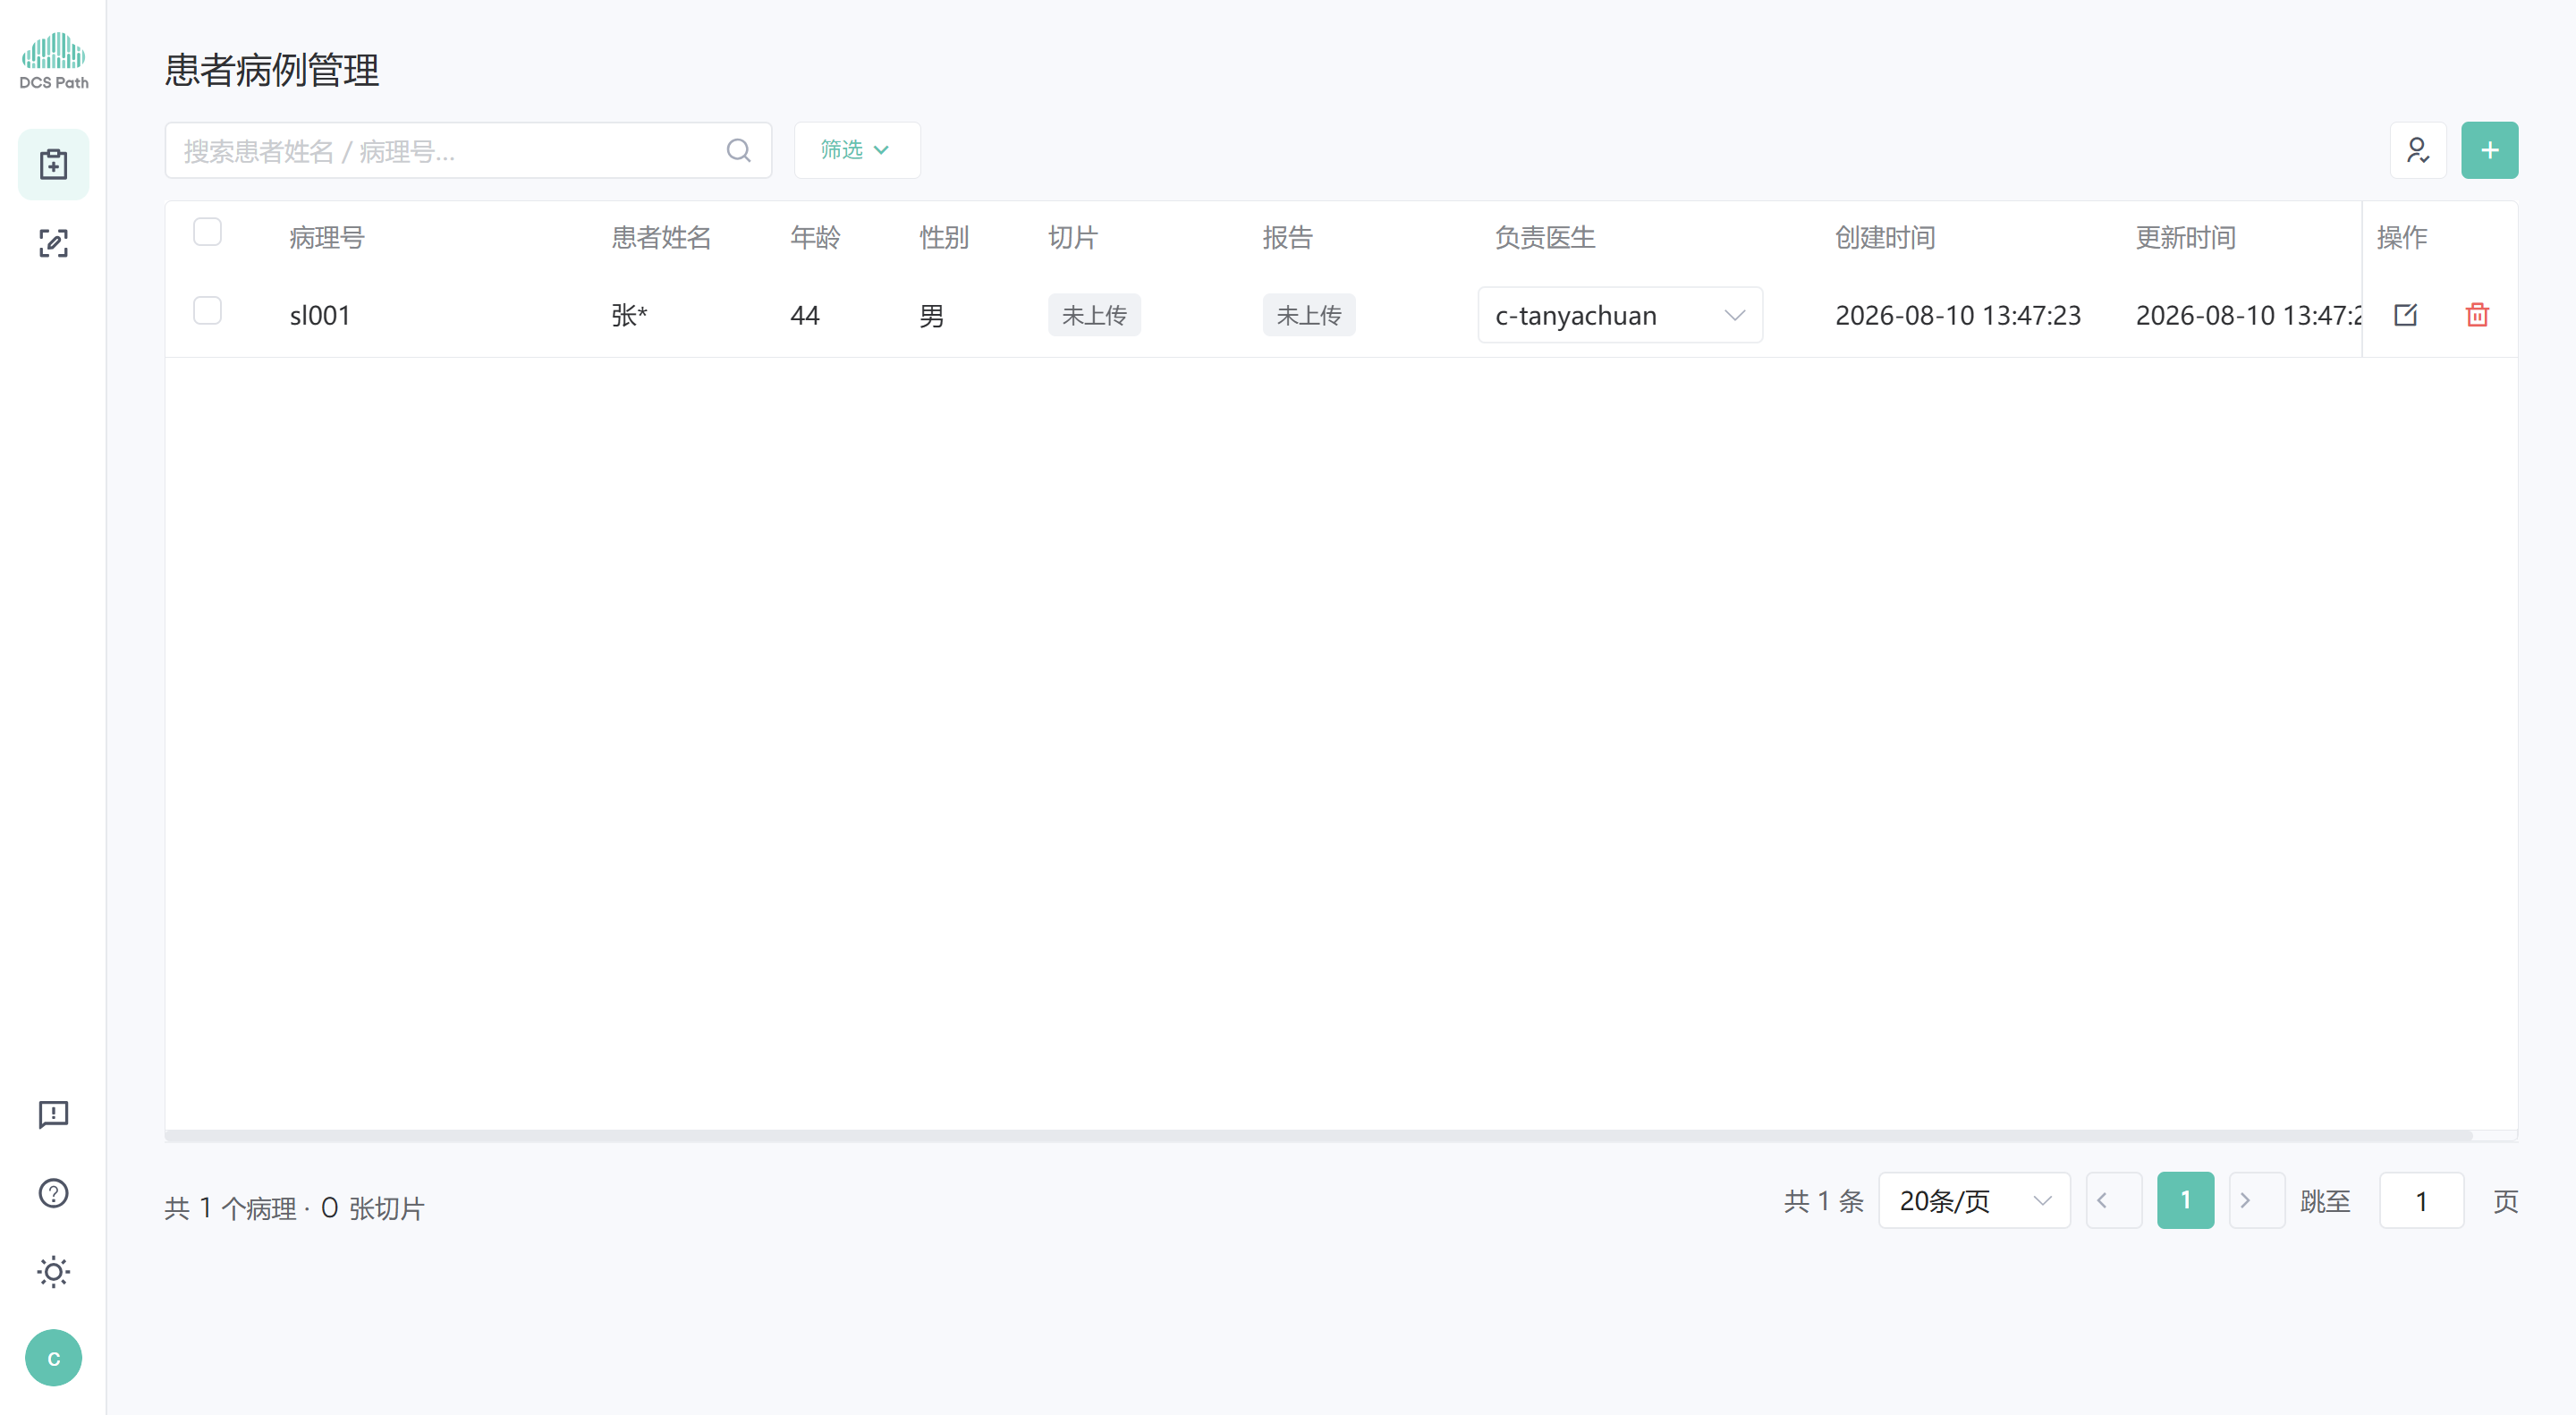
Interface highlights:
| Area | Description |
|---|---|
| Left icon bar | The top shows the DCS Path brand logo; below are module entries such as "Case Library" and "Annotation Workspace"; the bottom contains feedback, help, theme toggle, and user avatar |
| Top title area | Page title "Patient Case Management", with a search box on the right (by patient name / pathology number), a filter dropdown, and the My Cases and New Case (+) buttons in the top-right corner |
| Case list | Column headers include: Pathology Number, Patient Name, Age, Gender, Slide, Report, Attending Doctor, Created Time, Updated Time, Actions. The Slide/Report columns show the current status with an Not Uploaded tag |
| In-row actions | The "Actions" column on the right of each row provides Edit and Delete icons |
| Bottom status bar | Statistics on the left (e.g., "1 case in total · 0 slides"); pagination controls on the right (items per page, page turning, jump) |
2.2 Pathology Annotation Workspace
After entering the "Pathology Annotation" workspace, the interface is divided into five main areas:
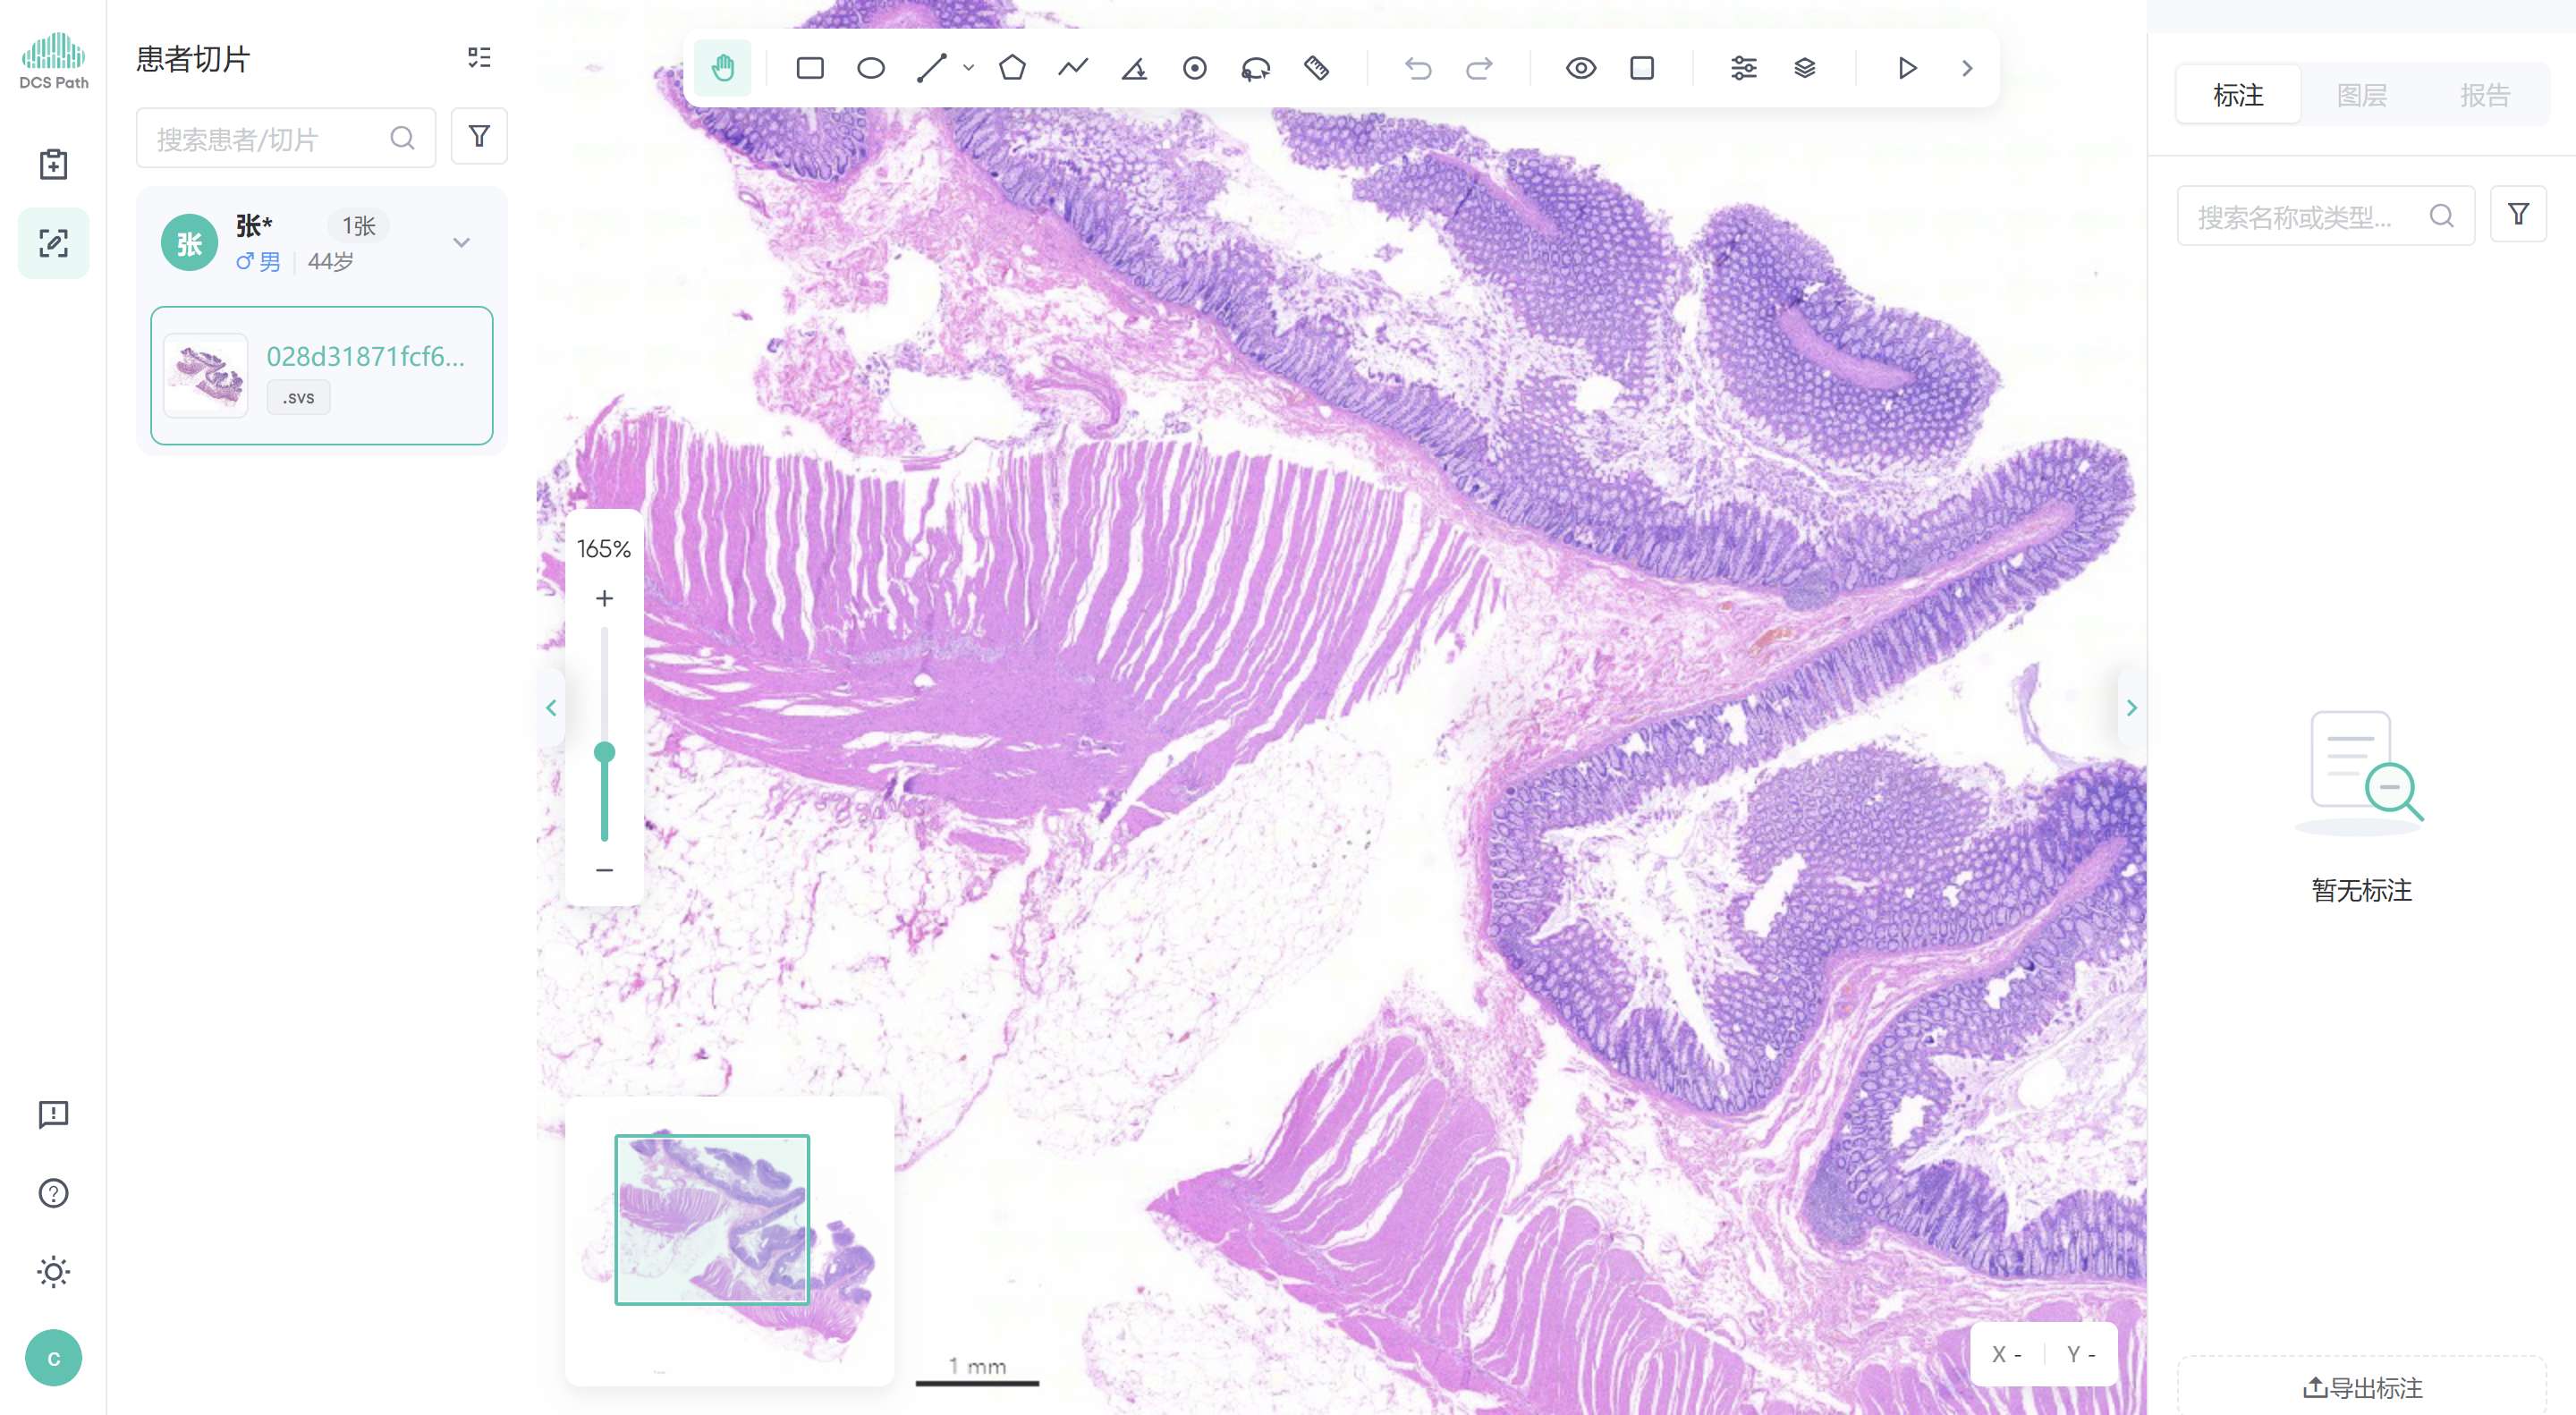
| Area | Name | Main Function |
|---|---|---|
| ① | Top navigation bar | Switch between the two main modules "Case Library" and "Pathology Annotation" |
| ② | Annotation toolbar | Select drawing tools, adjust the view, control overlay information, and enter preview |
| ③ | Left panel "Patient Slides" | Select patients, manage the slide list, and switch the current slide being read |
| ④ | Central canvas | Display slides and draw annotations, with zoom support |
| ⑤ | Right panel | "Annotation" list management and "Layers" (disabled in some versions) |
3. Case Library Management
3.1 Open the Case Library
Click the "Case Library" button in the top navigation bar to enter the Case Library main interface. Here you can browse all cases, search and locate, or create new cases.
3.2 Search and Filter Cases
- Keyword search: Enter
patient nameorpathology numberin the search box to quickly locate (placeholder: Search patient name / pathology number…). - Age range filter: Set "minimum age / maximum age".
- Slide count filter: Set "minimum slide count / maximum slide count" to quickly find cases with more or fewer slides.
3.3 Create a New Case
Enter pathology information in the New Case form. Fields include:
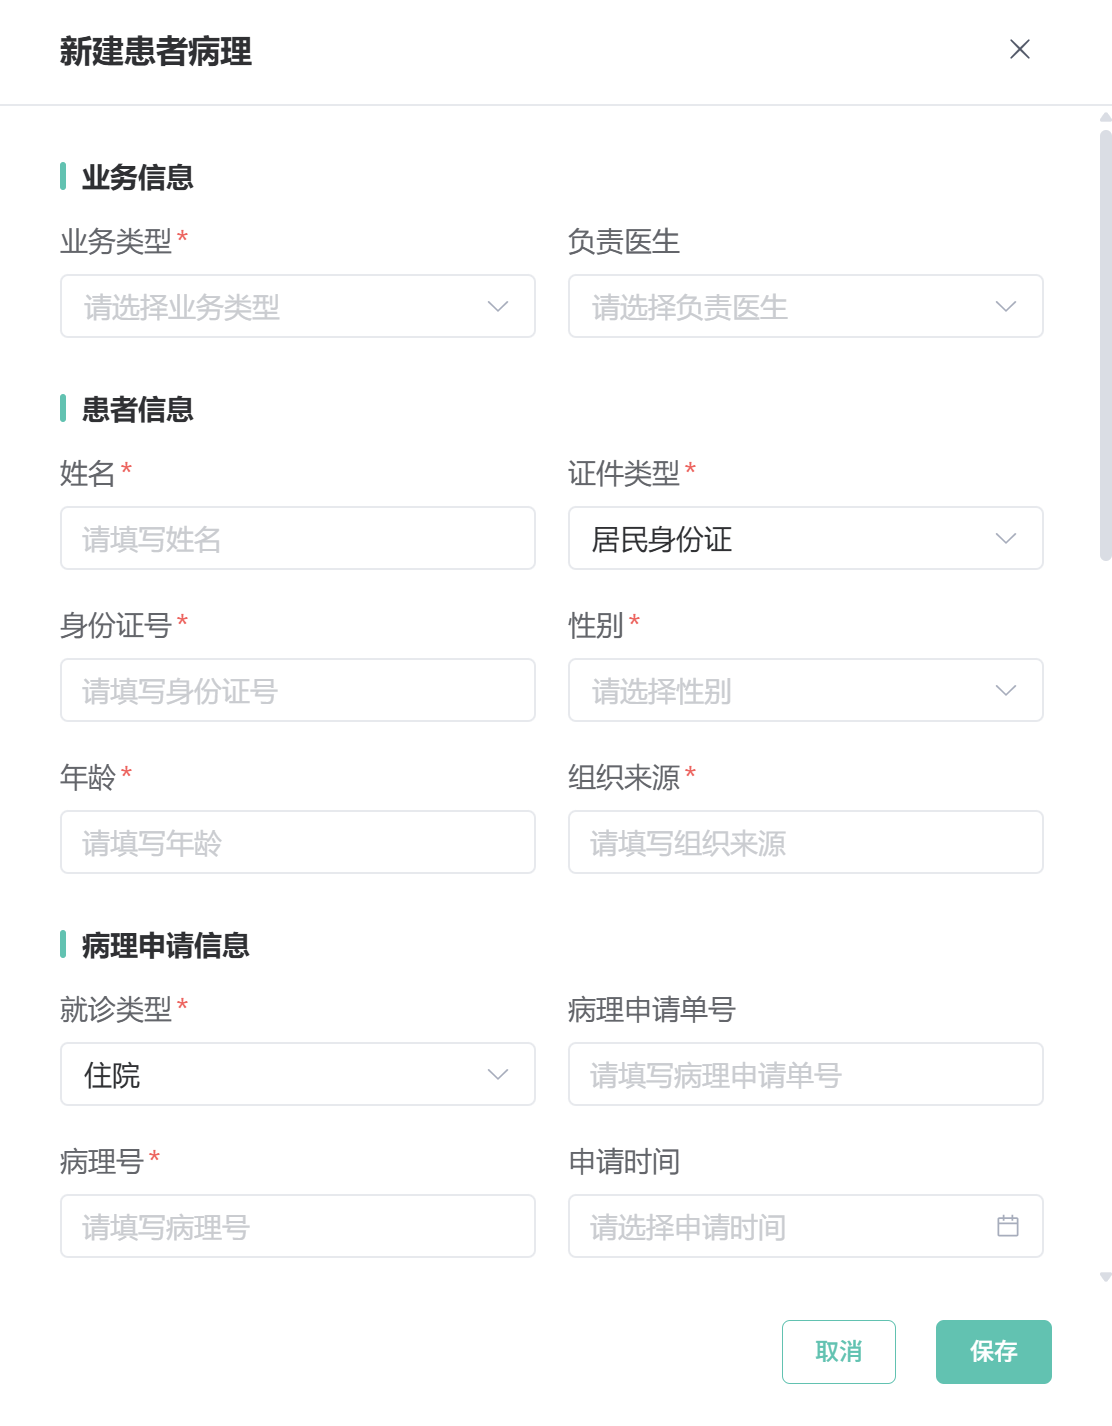
| Field Group | Fields |
|---|---|
| Patient Basic Information | Name, ID Number, Age, Tissue Source |
| Pathology Information | Pathology Request Number, Pathology Number, Request Time, Medical Insurance Code of Institution |
| Examination Information | Referring Hospital, Referring Department, Referring Doctor, Outpatient Number, Ward, Inpatient Number |
| Clinical Information | Clinical Diagnosis, Medical History Summary (multi-line text) |
Note:
Request Timeis entered via a date picker;Medical History Summarysupports multi-line long text. Fields marked with*are required — please fill them in completely to facilitate subsequent report archiving.
3.4 Select a Slide from the Case Library
Click "Select from Case Library" in the left panel, and a slide selection window will pop up:
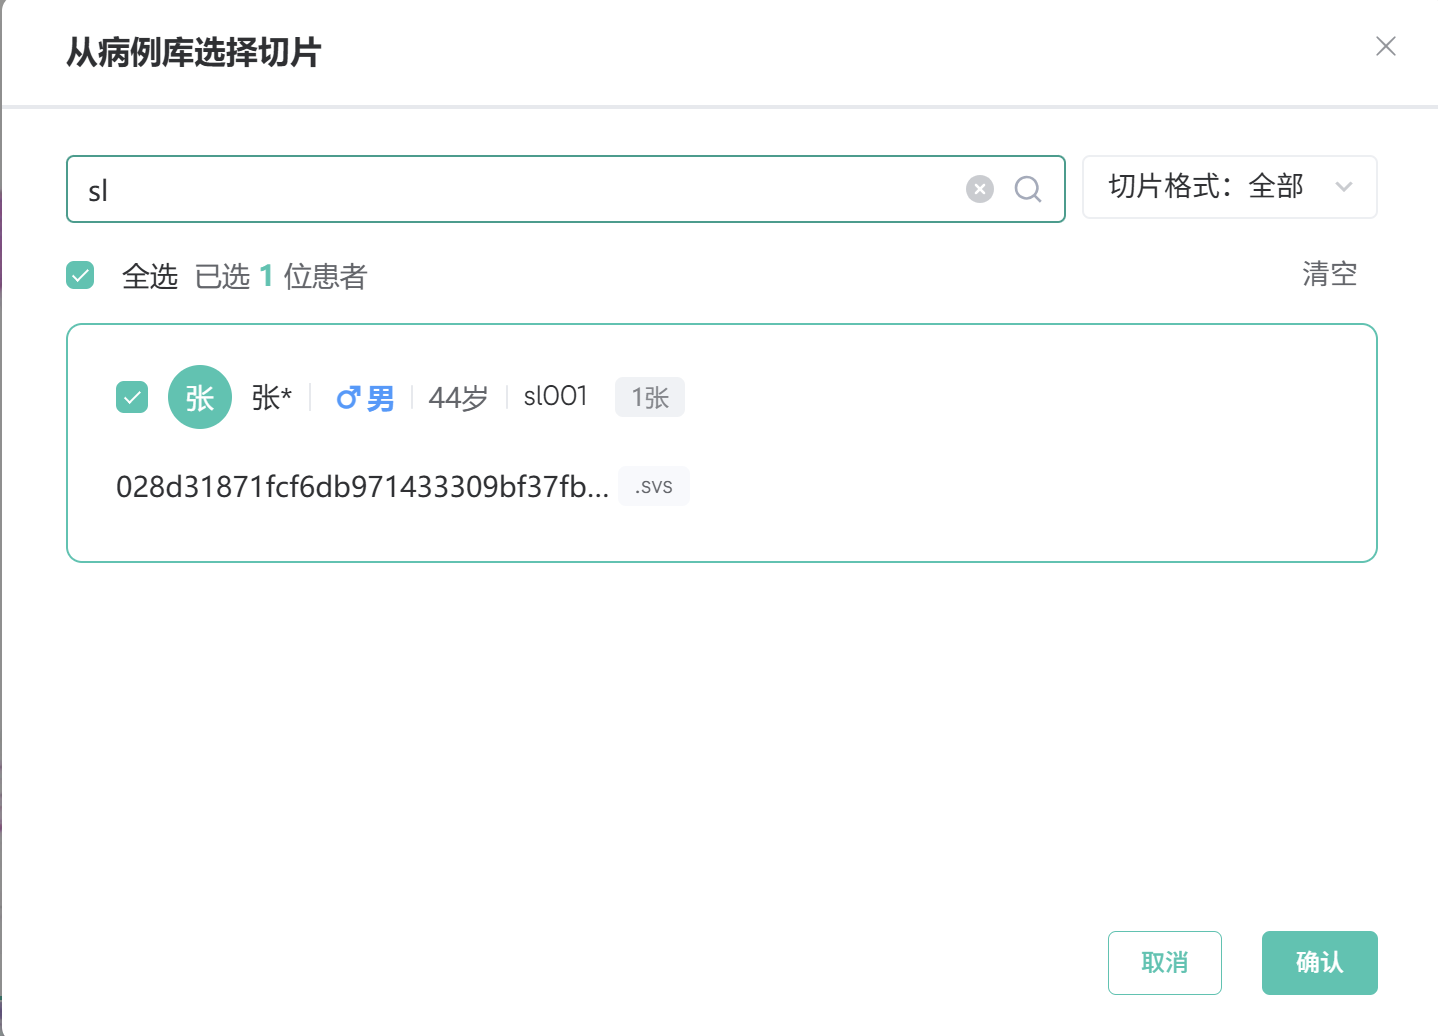
- The search box at the top supports combined retrieval by
patient name / pathology number / slide name. - After selecting and confirming the target slide, it will be loaded into the left "Patient Slides" list and opened in the canvas.
4. Patients and Slides (Left Panel)
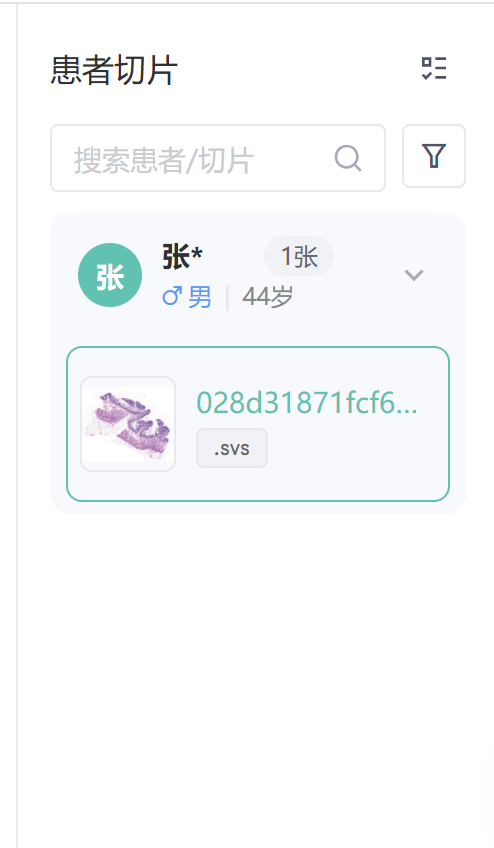
The left panel is titled "Patient Slides" and is the core area for managing the current reading subject.
4.1 Search and Filter
- Search box: Enter keywords to filter patients or slides (placeholder: Search patient/slide).
- Format filter: Click the filter button to filter by slide file format (e.g., view only
.svsor fluorescence slides).
4.2 Patient Cards
Each patient is presented as a card containing avatar, name, pathology number, and other information, and provides:
| Action | Description |
|---|---|
| Expand / Collapse | Click the arrow on the right of the card to expand or collapse the slide list under this patient |
| Delete | Click the close icon in the top-right corner of the card (shown on hover) to remove this patient group from the current list |
4.3 Slide List and Format Labels
After expanding a patient card, its slides are visible. Each slide displays a file name and a format label:
| Example Slide | Format Label | Meaning |
|---|---|---|
2017000002A-4_HE | .svs | HE-stained slide (Aperio format) |
HE-0517-01 | .ome.tif | HE-stained slide (OME-TIFF) |
IHC-0517-PDL1 | .tiff | Immunohistochemistry slide (PD-L1) |
FL-0517-DAPI | .ome.tiff | Fluorescence slide (DAPI channel) |
UPLOAD-0517-HE | Processing | Newly uploaded slide, being processed in the background, temporarily unavailable for reading |
When a slide label shows "Processing", it means the system is parsing the slide. Please wait and refresh before opening it.
Click any slide to load it into the central canvas for reading.
5. Slide Browsing and View Adjustment
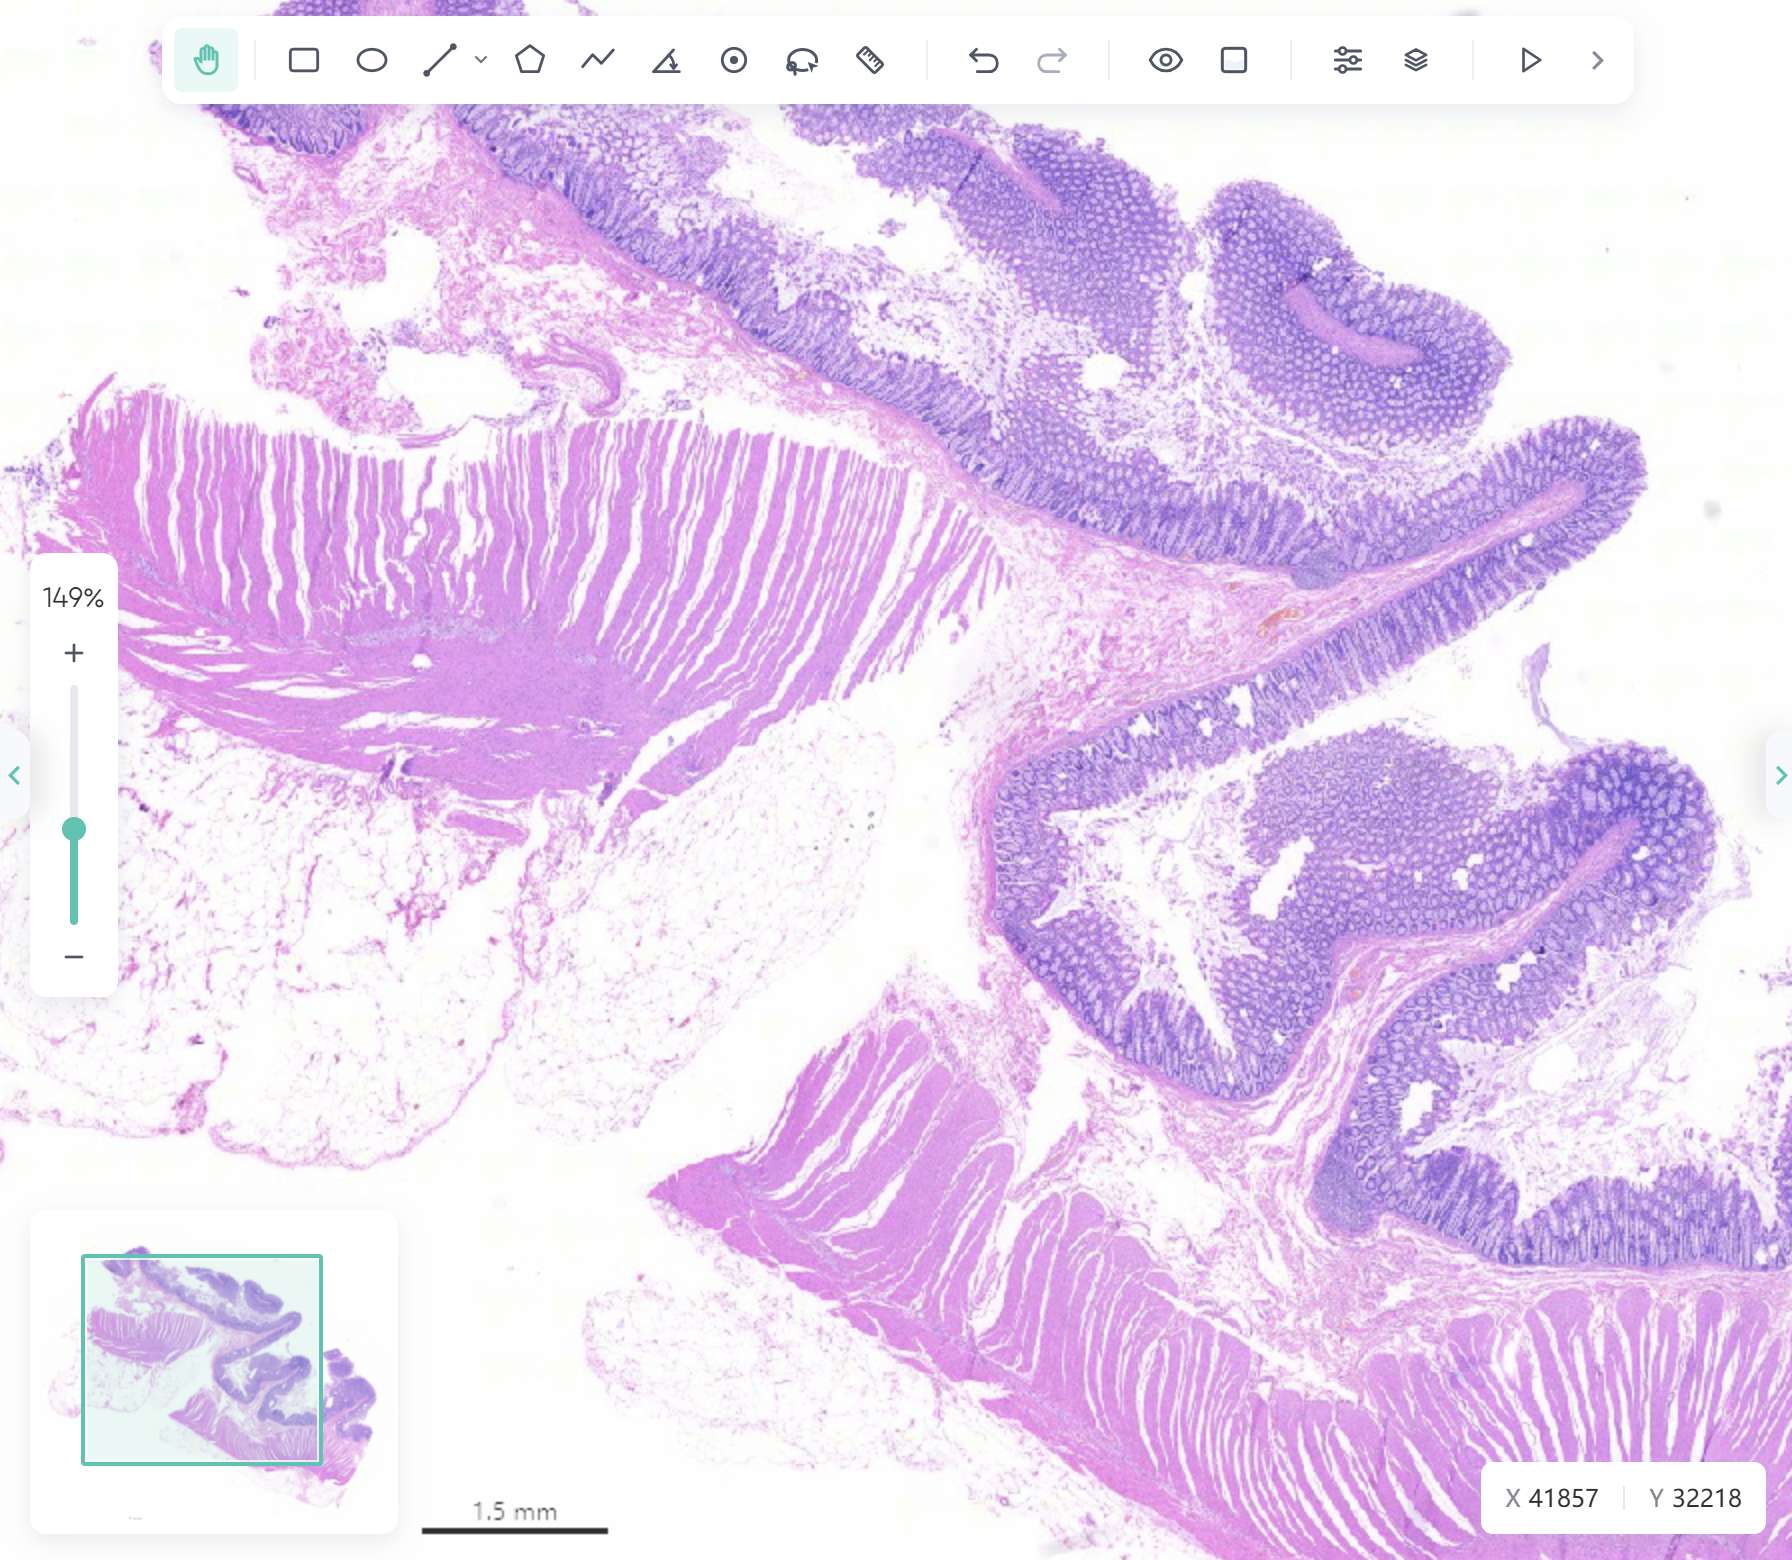
5.1 Zoom and Pan
- Zoom: Use the zoom controls in the bottom-right corner of the canvas (
+to zoom in /−to zoom out), or scroll the mouse wheel. - Pan: Press and drag on a blank area of the canvas to move the view.
5.2 View Adjustment Dialog
Click the View Adjustment button on the toolbar to open the adjustment panel:
| Parameter | Value Range | Default | Description |
|---|---|---|---|
| Brightness | -100 ~ 100 | 0 | Increase/decrease overall brightness |
| Contrast | -100 ~ 100 | 0 | Enhance/reduce light-dark contrast |
| Black-and-white inversion | On / Off | Off | Invert light and dark to facilitate observation of certain structures |
| Rotation | — | 0° | Rotate the slide orientation |
| Annotation opacity | 0 ~ 100 | 80 | Adjust the opacity of annotation graphics |
The bottom of the panel provides "Reset View" to restore all the above parameters to their default values with one click.
6. Creating Annotations
6.1 Select a Drawing Tool
Both the annotation toolbar and the graphic tool panel on the canvas provide the following tools. Click to select, then draw on the slide:
| Tool | Icon | Shortcut | Use Case |
|---|---|---|---|
| Rectangle | ▭ | R | Select regular regions (selected by default) |
| Ellipse | ◯ | O | Select circular/elliptical lesions |
| Line | ╱ | L | Measure the distance between two points |
| Polygon | ⬠ | P | Outline the boundary of irregular regions |
| Polyline | 〰 | V | Measure or mark along a path |
| Point | · | . | Mark a single point (e.g., cell, mitosis) |
6.2 Drawing Workflow
Click the target tool on the toolbar or canvas tool panel (or press the corresponding shortcut).
Press and drag on the slide (rectangle/ellipse/line) or click vertices in sequence (polygon/polyline) to complete an annotation graphic.
After drawing is complete, the system will:
- Generate the corresponding shape on the canvas;
- Automatically number and name the annotation (e.g., "Rectangle #1") and calculate measurements (e.g., area in μm²);
- Add a new record to the "Annotation" list on the right.
6.3 Undo and Redo
- Undo:
Ctrl + Z, revert the previous annotation operation. - Redo:
Ctrl + Y, redo the undone operation.
7. Managing Annotations (Right Panel)
The top of the right panel provides two tabs:
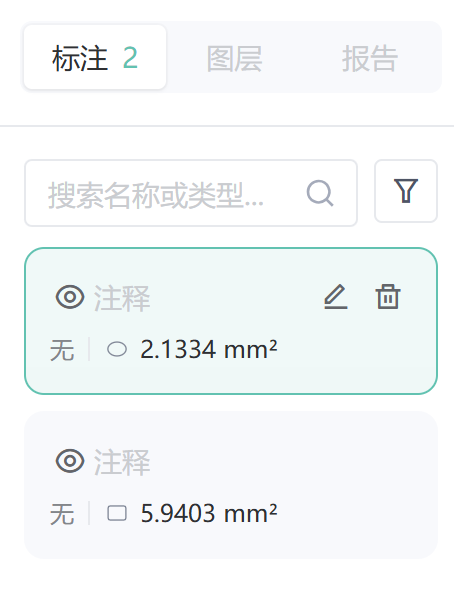
- Annotations (default): Displays all annotations of the current slide, with a count badge on the tab (e.g.,
3). - Layers: Layer management (temporarily disabled in some versions).
7.1 Search and Filter Annotations
- Search annotations: Enter keywords to filter annotations (placeholder: Search annotations...).
- Type filter: Filter the list by annotation type (e.g., tumor, stroma, abnormal).
7.2 Annotation List
Each annotation is displayed as a card, for example:
| Name | Type Label | Area | Description |
|---|---|---|---|
| Annotation | Abnormal | — | Generic annotation entry |
| Tumor Region #1 | Tumor | 6,002,390.28 μm² | Highlighted when selected |
| Stroma Region #1 | Stroma | 1,200,000 μm² | — |
| Key Point #1 | — | — | Point annotation |
Each annotation provides:
| Action | Description |
|---|---|
| Click to select | Highlight the annotation and locate it in the canvas |
| Edit | Open the annotation edit dialog to modify name/type/note (see Section 8) |
| Delete | Remove the annotation (cannot be auto-restored, please proceed with caution) |
Measurements such as area are automatically calculated and displayed in μm² (square micrometers), no manual input required.
8. Editing Annotation Attributes
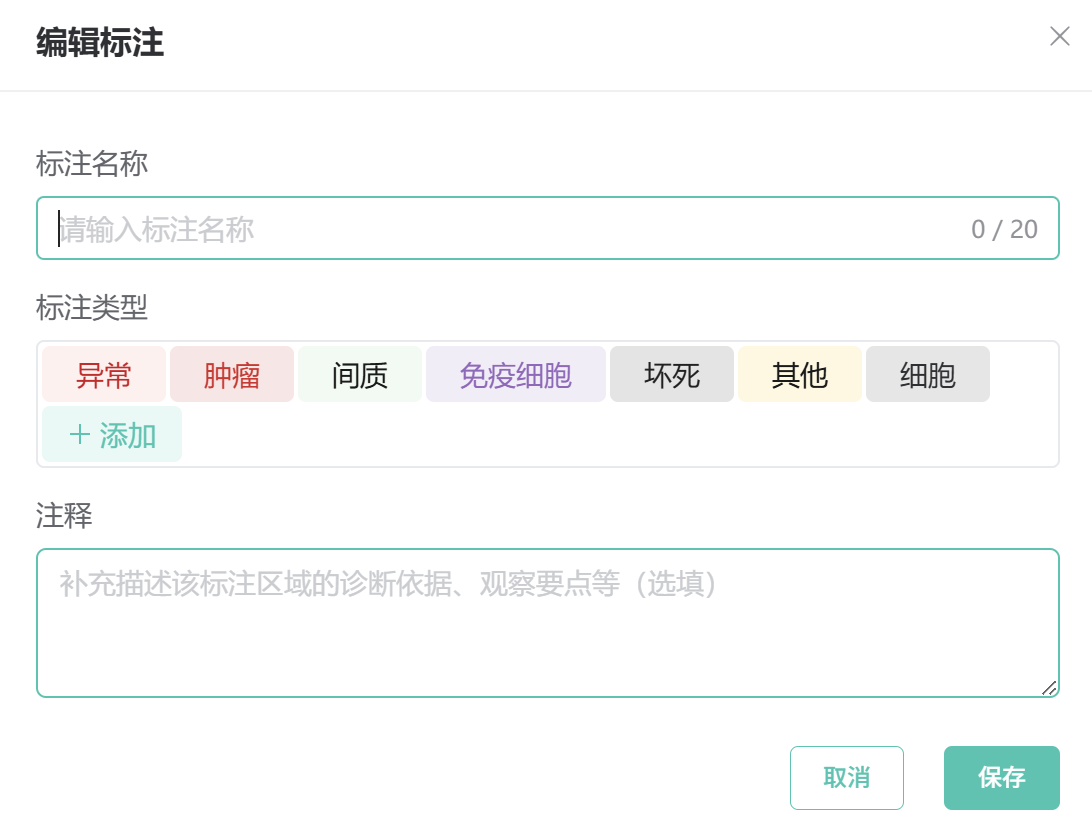
Click the Edit button of a record in the annotation list to open the "Edit Annotation" dialog:
| Field | Description |
|---|---|
| Annotation Name | Custom name |
| Annotation Type | Select from the type label group, such as Tumor / Stroma / Abnormal, etc. |
| New Type | Click the + in the type area, enter a type name, and press Enter to confirm and add a custom type label |
| Note | Add a description of the diagnostic basis, observation points, etc. of the annotation region (optional) |
After editing, save, and the annotations in the list and canvas will be updated synchronously.
Type labels support customization and deletion: in the type label group, hover over a label to see the red delete icon, and click to remove the custom type.
9. Overlay Display and Preview
9.1 Overlay Display Dialog
Click the Overlay Display button on the toolbar to control the visibility of overlay information on the canvas:
| Overlay Item | Default Status | Description |
|---|---|---|
| Scale bar | On | Display a physical-scale ruler on the canvas |
| Hover info | On | Show coordinate/measurement tips on mouse hover |
| Thumbnail | On | Display a thumbnail navigation map of the whole slide |
Click each toggle to switch visibility.
10. Frequently Asked Questions (FAQ)
Q1: What should I do if a slide keeps showing "Processing"?
A: Newly uploaded slides need background parsing (WSI files are large and take longer). Please wait and refresh the slide list on the left. Once processing is complete, the label will change to the corresponding format (e.g., .svs), and you can click to read it.
Q2: The annotation is drawn but I can't see the slide clearly?
A: Open "View Adjustment" and appropriately reduce the annotation opacity (default 80), or increase the slide brightness/contrast; you can also temporarily turn off some overlay items in "Overlay Display".
Q3: Can I restore an annotation I accidentally deleted?
A: Operations during drawing can be undone with Ctrl + Z. If you have already deleted it from the list, it is recommended to redraw; please use the delete operation with caution.
Q4: What is the unit of area? Do I need to measure it manually?
A: Area is in μm² (square micrometers). After drawing an annotation, it is automatically calculated by the system based on the physical resolution of the slide, no manual measurement required.
Q5: What if there aren't enough type labels?
A: Click the + in the type area of the annotation edit dialog, enter a name (≤12 characters), and press Enter to add a custom type; hover over an existing custom label to delete it.